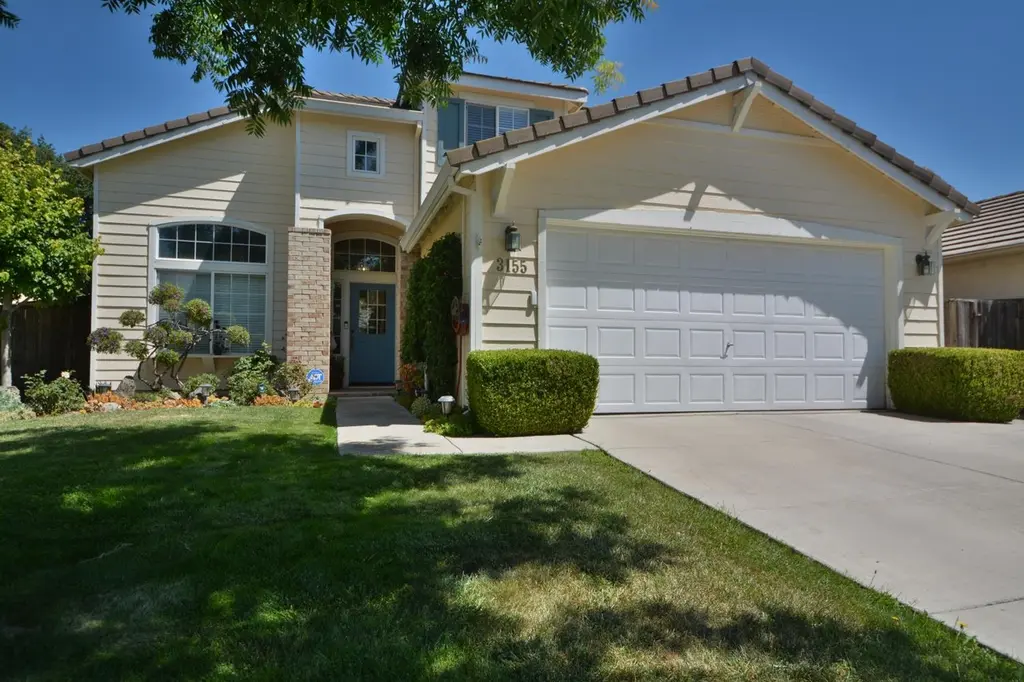
3155 Autumn Chase Cir
Stockton, CA 95219
$539,000D+
4 bd · 3.0 ba ·
2,095 sqft ·
Built 1998
· SingleFamily
· Active
· 17 DOM
Cashflow @ list (25.0% down · 7.5%)
Estimated rent
$3,606/mo
Mortgage (P&I)
−$2,827
Tax + insurance
−$611
HOA
−$152
Vac / Maint / Mgmt
−$757
Net cashflow
$-741/mo
Annual
$-8,887/yr
Cap rate
4.64%
Cash-on-cash
-5.89%
DSCR
0.74
1% rule
0.67%
Cash to close
$150,920
Investor read
- This is a 4-bed/3.0-bath single-family listed at $539k.
- At list price, monthly cash flow is $-741 ($-9k/yr) — negative.
- To cash-flow at today's rent, offer at most $408k (24.3% below list).
- To meet the 1% rule (rent ≥ 1% of price), the offer needs to be $361k (33.1% below list).
- It's been on market 17 days — a 2% lower offer ($531k) is reasonable based on typical stale-listing flexibility.
- Recommended offer: $361k (33.1% below list) — sets the bar for 1% rule.
- In year one you build about $58k of equity ($4k loan paydown + $54k appreciation (10.0% local appreciation)).
- Location reads 57/100 on livability (#734 in CA) — a working-class tenant base; expect higher turnover. Strengths: housing A+, health & safety A, amenities A-; Watch: employment C-, schools D-, crime F.
- Lincoln Unified (urban): math 26% / reading 41% proficiency, ranked #284 of 517 in CA (top 55%) — families likely to look elsewhere, expect single-tenant / working-renter base with shorter leases.
- Market conditions: Rents rising fast (+4.2%/yr); 216 active listings in the ZIP; 7 comparable units currently listed for rent nearby; rentals at typical pace (median 25d on market — plan ~3-4 weeks tenant-placement turnaround); 43% of comp listings sitting > 30 days — soft ceiling on asking rent; high-income renter base; 3,779 units permitted in San Joaquin County in 2024 (0 in 5+ unit buildings).
- San Joaquin County population projected at +17% by 2050 — long-run rental-demand tailwind backs the buy-and-hold thesis.
- Current owner paid $270k; list at $539k implies a 100% gain — meaningful room to come down on a strong offer.
- By year 2, paydown + projected appreciation supports a ~$93k cash-out refi (75% LTV) — recoverable capital for the next deal without selling this one.
- Climate carrying-cost: extreme-heat days projected 7→15/yr by 2055 (HVAC capex compounding) — expect insurance premiums to compound above CPI over the hold.
- Cap rate 4.6% vs local median 3.6% in Stockton — meaningfully above typical; check what's discounted (condition, days-on-market, listing class) to confirm the premium yield is real.
- This rent runs 39% of the median local income ($112k/yr) — at the standard rent-burdened threshold; future hikes will face affordability resistance.
Questions for listing agent
- What do current leases actually rent for vs. the listed asking? Can we see a recent rent roll and the last 12 months of T-12 income?
- What does the HOA fee cover, when was the last increase, and are there any pending special assessments or reserve-fund shortfalls?
- Is there a deadline driving the sale (1031 exchange, divorce, estate, relocation)? That informs how much negotiation room exists.
- Schools are D-rated, which usually means shorter tenancies and higher turnover. Who's the typical renter profile here, and what's been the actual vacancy rate?
- Crime grade is F in this area — have there been break-ins, vandalism, or insurance claims at this property in the last 3 years? What carrier currently insures it and at what premium?
- The area grade is low — what's the realistic commute time and amenity access for the typical tenant pool here? Any planned neighborhood developments (good or bad) we should know about?
- This sits on a lake — are riparian / water-frontage rights deeded with the parcel? Any dock permits, shoreline easements, or HOA water-use restrictions?
- What's the documented flood / surge / shoreline-erosion history here (FEMA AND non-FEMA — e.g., storm surge, creek backup, septic-field saturation)?
CashFlowRE · CFR-7B0Q42AN3W0G5D
· Data 8 h ago
cashflowre.app · 2026-05-29