 🌊 Lakefront
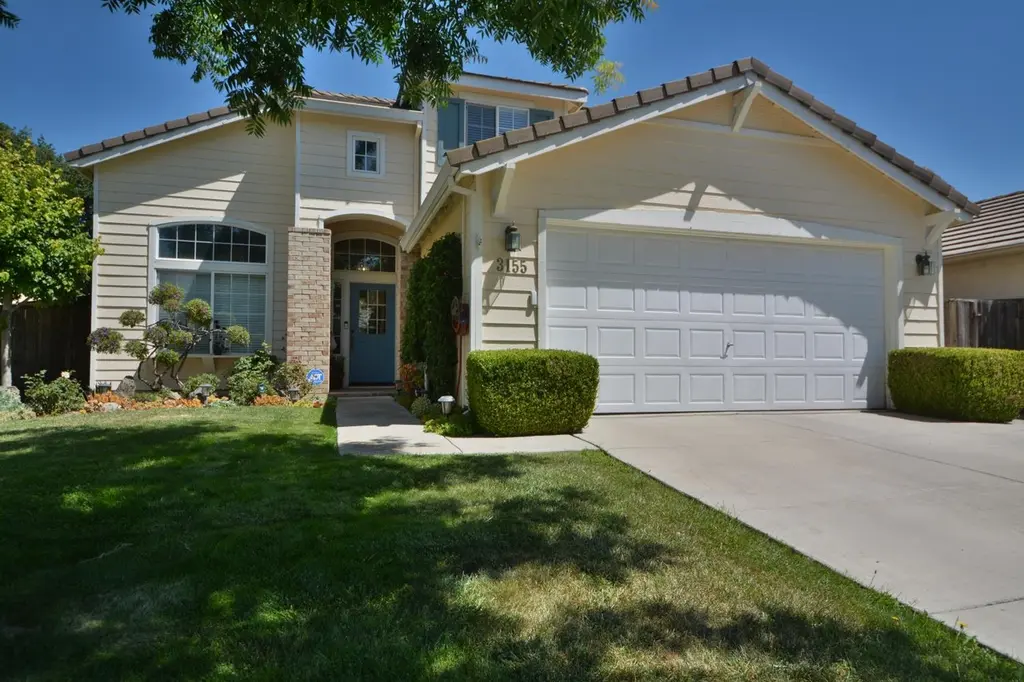
3155 Autumn Chase Cir · Stockton, CA
Flood risk 1/10 · Minimal
- FEMA flood zone
- X
- Chance of flooding over 30 yrs
- 0.0%
- Est. flood insurance / yr
- $507 – $1,088
Fire risk 1/10 · Minimal
- Est. fire insurance / yr
- $659 – $1,223
Heat risk 7/10 · Major
- Hot days now (above 103°F)
- 7 days/yr
- Hot days in 30 yrs
- 15 days/yr
Wind risk 1/10 · Minimal
- Chance of severe wind over 30 yrs
- —
Air-quality risk 10/10 · Severe
- Unhealthy air days now
- 22 days/yr
- Unhealthy air days in 30 yrs
- 24 days/yr
Risk factors via First Street. Map © Google.
Why this score? — see what drove the D+ grade
The composite is a weighted blend of 9 inputs, each scored 0–100. Each bar is that input's sub-score; the figure is the points it added to the 100-point composite (weight × sub-score).
- ARV discount +15.0/15.0
- Appreciation +10.0/10.0
- Cash flow +7.2/30.0
- Rent growth +3.5/5.0
- Schools +3.0/10.0
- Livability +2.9/5.0
- Condition / age +2.5/5.0
- 1% rule +1.7/10.0
- DSCR +1.4/10.0
$539,000
🖨 Deal sheet (PDF) 📄 Offer letter ✓ Due diligence
Listing remarks
This beautiful home features 3 bedrooms plus a den downstairs which can be converted to a 4th bedroom, and there are 3 full baths. This home is well maintained and is located in a gated community with similar homes displaying high pride of ownership throughout the neighborhood. Enjoy the beautifully landscaped backyard with no rear neighbors. There is a gate which opens in the back which gives you access to the walking path along the water. This home is a must see!
Key facts
- Gated community
- Landscaped backyard
- 6,046 sq ft lot
Tags
Property features AI
Finance
- HOA & community: Mandatory homeowners association; Quarterly HOA fee; HOA provides access to a community pool; HOA fee covers pool and other community items
Exterior
- Parking: Attached garage with 2 spaces; Garage door opener; Garage faces front
- Utilities: Natural gas connected; 220 volt electrical service; Public water; Public sewer; No irrigation
- Home design: Single family detached residence in a planned unit development; 2 story
- Construction: Tile roof; Built in 1998
- Exterior features: Gated community; Low maintenance yard; No private pool or spa
Interior
- Kitchen: Island; Kitchen open to family room; Tile countertops; Free standing gas range; Range hood; Dishwasher; Disposal
- Bedrooms: 3 bedrooms (possible 4th); Main and upper levels contain bedrooms; master on upper level with walk-in closet
- Flooring: Carpet; Laminate; Tile
- Bathrooms: 3 full bathrooms; Master bath with shower stall(s), double sinks and tub; Jack and Jill bathroom; tubs with shower over
- Heating & cooling: Central heating; Central air conditioning
- Interior features: Cathedral ceiling; Family room fireplace
- Laundry & utility: Laundry on ground floor inside room with hookups and cabinets
Neighborhood map
What this means for you Summary
Snapshot
- This is a 4-bed/3.0-bath single-family listed at $539k.
Deal economics
- At list price, monthly cash flow is $-741 ($-9k/yr) — negative.
- To cash-flow at today's rent, offer at most $408k (24.3% below list).
- To meet the 1% rule (rent ≥ 1% of price), the offer needs to be $361k (33.1% below list).
- Recommended offer: $361k (33.1% below list) — sets the bar for 1% rule.
- Cap rate 4.6% vs local median 3.6% in Stockton — meaningfully above typical; check what's discounted (condition, days-on-market, listing class) to confirm the premium yield is real.
Location & tenants
- Location reads 57/100 on livability (#734 in CA) — a working-class tenant base; expect higher turnover. Strengths: housing A+, health & safety A, amenities A-; Watch: employment C-, schools D-, crime F.
- Lincoln Unified (urban): math 26% / reading 41% proficiency, ranked #284 of 517 in CA (top 55%) — families likely to look elsewhere, expect single-tenant / working-renter base with shorter leases.
- Market conditions: Rents rising fast (+4.2%/yr); 216 active listings in the ZIP; 7 comparable units currently listed for rent nearby; rentals at typical pace (median 25d on market — plan ~3-4 weeks tenant-placement turnaround); 43% of comp listings sitting > 30 days — soft ceiling on asking rent; high-income renter base; 3,779 units permitted in San Joaquin County in 2024 (0 in 5+ unit buildings).
- This rent runs 39% of the median local income ($112k/yr) — at the standard rent-burdened threshold; future hikes will face affordability resistance.
Forward outlook
- In year one you build about $58k of equity ($4k loan paydown + $54k appreciation (10.0% local appreciation)).
- San Joaquin County population projected at +17% by 2050 — long-run rental-demand tailwind backs the buy-and-hold thesis.
- By year 2, paydown + projected appreciation supports a ~$93k cash-out refi (75% LTV) — recoverable capital for the next deal without selling this one.
Negotiation context
- It's been on market 17 days — a 2% lower offer ($531k) is reasonable based on typical stale-listing flexibility.
- Current owner paid $270k; list at $539k implies a 100% gain — meaningful room to come down on a strong offer.
Risks & watch-outs
- Climate carrying-cost: extreme-heat days projected 7→15/yr by 2055 (HVAC capex compounding) — expect insurance premiums to compound above CPI over the hold.
Questions for the listing agent
- What do current leases actually rent for vs. the listed asking? Can we see a recent rent roll and the last 12 months of T-12 income?
- What does the HOA fee cover, when was the last increase, and are there any pending special assessments or reserve-fund shortfalls?
- Is there a deadline driving the sale (1031 exchange, divorce, estate, relocation)? That informs how much negotiation room exists.
- Schools are D-rated, which usually means shorter tenancies and higher turnover. Who's the typical renter profile here, and what's been the actual vacancy rate?
- Crime grade is F in this area — have there been break-ins, vandalism, or insurance claims at this property in the last 3 years? What carrier currently insures it and at what premium?
- The area grade is low — what's the realistic commute time and amenity access for the typical tenant pool here? Any planned neighborhood developments (good or bad) we should know about?
- This sits on a lake — are riparian / water-frontage rights deeded with the parcel? Any dock permits, shoreline easements, or HOA water-use restrictions?
- What's the documented flood / surge / shoreline-erosion history here (FEMA AND non-FEMA — e.g., storm surge, creek backup, septic-field saturation)?
- Any water-quality or seasonal algae-bloom issues that affect tenant satisfaction or short-term-rental demand?
- What's the average days-on-market for RENTAL listings here right now (not sales)? A rising rental-DOM trend means longer vacancies and softer asking-rent achievability than the comps imply.
- What's the recent tenant-quality profile in this submarket — average credit score on applications, eviction rate, late-payment / NSF rate, and stable-employment percentage? A property-management company in the area should have these aggregated.
- How much new for-sale + rental construction is in the pipeline within 1–3 miles? Heavy new supply typically softens prices + rents 12–24 months out; constrained supply supports both.
Investment metrics
- 1% rule
- 0.67% ✗
- Cap rate
- 4.64%
- Cash-on-cash
- -5.89%
- DSCR
- 0.74
- GRM
- 12.5
CMA / ARV
- ARV (on-the-fly)
- $749,486
- Comps found
- 12
Show comp detail 12 sales within ~0.75 mi
| Address | Dist | Beds/Ba | Sqft | Sold | Price | $/sf | Match |
|---|---|---|---|---|---|---|---|
| 3105 Autumn Chase Cir | 0.19mi | 4/3.0 | 2,095 (0%) | 3mo | $555,000 | $265 | 89 |
| 5533 Brook Falls Ct | 0.08mi | 4/3.0 | 1,972 (-6%) | 2mo | $510,000 | $259 | 84 |
| 3863 Brook Valley Cir | 0.30mi | 4/2.0 | 2,061 (-2%) | 5mo | $560,000 | $272 | 75 |
| 3593 Shadowbrook Dr | 0.55mi | 4/3.0 | 2,104 (+0%) | 2mo | $556,000 | $264 | 72 |
| 5535 Thornhill Ct | 0.26mi | 4/3.0 | 2,311 (+10%) | 4mo | $570,000 | $247 | 68 |
| 5522 Teal Ct | 0.56mi | 3/2.0 (-1) | 2,040 (-3%) | 6mo | $535,000 | $262 | 56 |
| 6503 Pine Meadow Cir | 0.55mi | 4/2.5 | 1,932 (-8%) | 5mo | $535,000 | $277 | 55 |
| 3602 Portage Cir | 0.39mi | 3/2.0 (-1) | 1,839 (-12%) | 2mo | $652,000 | $355 | 51 |
| 2303 Pheasant Run Cir | 0.71mi | 3/2.0 (-1) | 2,194 (+5%) | 2mo | $495,000 | $226 | 49 |
| 4333 Mallard Creek Cir | 0.69mi | 3/2.5 (-1) | 1,989 (-5%) | 6mo | $513,000 | $258 | 48 |
| 3718 Wood Duck Cir | 0.73mi | 3/2.0 (-1) | 2,257 (+8%) | 0mo | $630,000 | $279 | 44 |
| 6123 Cumberland Pl | 0.63mi | 3/2.0 (-1) | 1,808 (-14%) | 3mo | $493,000 | $273 | 36 |
Match score weights: distance 35% · size 25% · config 20% · recency 20%. Top-matched comps best support the ARV.
Projected returns pro-forma
10.0% appreciation · 4.16% rent growth · sell at horizon
- IRR
- 20.4%
- Equity multiple
- 2.66×
- Total profit
- $250,613
- Equity at exit
- $485,574
- IRR
- 18.8%
- Equity multiple
- 6.20×
- Total profit
- $784,107
- Equity at exit
- $1,047,158
Cash invested: $150,920 (down + closing). Projections, not guarantees.
Landlord ↔ Tenant lean methodology
- Overall (STATE)
- 18 Strongly Tenant-Friendly
- State California
- 18 Strongly Tenant-Friendly · D+13
- County
- — inherits STATE
- City
- — inherits STATE
ZIP-level market 95219
- Home prices YoY
- 6.6%
- Rents YoY
- 4.2%
- Active inventory
- 216
- Price-to-rent
- 12.5×
Monthly cashflow live
- Estimated rent
- $3,606 high interval (Pro) →
- Mortgage (P&I)
- −$2,827
- Tax from tax record
- −$386 /mo · $4,631/yr
- Insurance
- −$225
- HOA
- −$152
- Vacancy / Maint / Mgmt
- −$757
- Net cashflow
- $-741
Break-even live
Sensitivity live
| Price | -10% $-435 | -5% $-588 | +0% $-741 | +5% $-893 | +10% $-1,046 |
|---|---|---|---|---|---|
| Rent | -10% $-1,025 | -5% $-883 | +0% $-741 | +5% $-598 | +10% $-456 |
| Rate | -1.0pp $-469 | -0.5pp $-603 | base $-741 | +0.5pp $-880 | +1.0pp $-1,022 |
UW: 25.0% down · 7.5% · 30yr · 1.5% tax · 5.0% vac · 8.0% maint · 8.0% mgmt
Financing live
Cash to close
- Down payment
- $134,750
- Closing costs
- $16,170
- Reserves months
- —
- Total cash needed
- —
Loan-product check · same deal, 3 products live
Conventional
25% down · 7.5% · 30yr
- Down + closing
- —
- Monthly P&I
- —
- Monthly cashflow
- —
- DSCR
- —
- Eligible?
- —
Personal DTI + credit; lowest rate.
DSCR
20% down · 8.5% · 30yr
- Down + closing
- —
- Monthly P&I
- —
- Monthly cashflow
- —
- DSCR
- —
- Eligible?
- —
No personal income docs; deal must DSCR.
Hard money
10% down · 12.0% · 12mo
- Down + closing
- —
- Monthly P&I
- —
- Monthly cashflow
- —
- DSCR
- —
- Eligible?
- —
Short-term bridge; refi at stabilization.
Rent comps 7 comps
| Address | Beds | Baths | Sqft | Rent | $/sqft | DOM | Units | Dist |
|---|---|---|---|---|---|---|---|---|
| 3906 Brook Valley Cir Stockton, CA | 4.0 | 3.0 | 2426 | $3,100 | $1.28 | 45d | 1 | 0.44mi |
| 5007 Innisbrook Dr Stockton, CA | 3.0 | 2.0 | 1723 | $3,200 | $1.86 | 45d | 1 | 0.45mi |
| 3616 Wood Duck Cir Stockton, CA | 5.0 | 3.0 | 2302 | $7,500 | $3.26 | 24d | 1 | 0.52mi |
| 3915 Bridlewood Cir Stockton, CA | 3.0 | 2.0 | 1406 | $2,795 | $1.99 | 22d | 1 | 0.84mi |
| 4609 Da Vinci Dr Stockton, CA | 3.0 | 2.5 | 1592 | $2,000 | $1.26 | 4d | 1 | 0.90mi |
| 2537 Plymouth Oaks Ct Stockton, CA | 3.0 | 2.5 | 1500 | $2,350 | $1.57 | 45d | 1 | 1.29mi |
| 3936 Dennis Ave Stockton, CA | 4.0 | 2.0 | 1583 | $2,625 | $1.66 | 3d | 1 | 1.31mi |
HOA detail
- Monthly dues
- $152 · $1,824/yr
- Likely covers
- watersecurity
Listing history 12 events
-
2026-06-21days on market $539,000 Active 17 DOM
-
2026-06-18days on market $539,000 Active 14 DOM
-
2026-06-17days on market $539,000 Active 13 DOM
-
2026-06-16days on market $539,000 Active 12 DOM
-
2026-06-15days on market $539,000 Active 11 DOM
-
2026-06-14days on market $539,000 Active 9 DOM
-
2026-06-13days on market $539,000 Active 8 DOM
-
2026-06-10days on market $539,000 Active 6 DOM
-
2026-06-09days on market $539,000 Active 5 DOM
-
2026-06-08days on market $539,000 Active 4 DOM
-
2026-06-07remarks 469-char remark
-
2026-06-07$539,000 Active 3 DOM
ⓘ Source: listings_history table (triggers on properties + properties_extension) + one-shot
backfill from property_details.listing_events for pre-trigger history.
Tax reassessment forecast CA · Resets to sale price
- Current annual tax
- $4,631 · $386/mo
- Projected year-2 tax
- $4,631 · $386/mo
- Expected delta
- $0/yr ($0/mo · 0.0%)
ⓘ Screening estimate from a state-policy table — verify with the county assessor before closing.
Climate risk First Street
- Flood 1/10 Low FEMA zone X · 0% chance over 30 yrs
- Wildfire 1/10 Low
- Heat 7/10 Severe 7 d/yr ≥103°F today · 15 d/yr by 30 yrs out
- Wind 1/10 Low
- Air quality 10/10 Extreme 22 unhealthy d/yr today · 24 by 30 yrs out
Nearby sold comps map
Loading sold comps map…
Walkable amenities ~0.75 mi
Loading nearby amenities…
Taxation est. · year 1
- Rental income
- $43,269
- − Mortgage interest
- −$30,192
- − Property taxes
- −$4,631
- − Insurance
- −$2,695
- − Repairs & maintenance
- −$3,461
- − Management
- −$3,461
- − HOA
- −$1,824
- − Depreciation
- −$15,680
- Taxable loss
- −$18,677
- Est. tax savings @ 24.0%
- +$4,482
- After-tax cash flow
- $-4,404/yr
For passive investors: Depreciation is non-cash, so a rental often shows a tax loss while cash-flowing — sheltering income. Rental losses are passive: they offset passive income freely, and up to $25,000/yr can offset ordinary (W-2) income if you actively participate and your MAGI is under $100k (phasing out to $0 by $150k); unused losses carry forward. On sale, claimed depreciation is recaptured at up to 25%, and gains may owe capital-gains tax (a 1031 exchange can defer both). Figures are a year-1 estimate at your 24.0% rate — not tax advice; consult a CPA.
Schools (NCES district)
- District
- Lincoln Unified
- NCES district ID
- 0621690
- Math proficiency
- 26% ▼ -11.00%
- Reading proficiency
- 41% ▼ -11.00%
- Median HH income
- $56,356
- Composite
- 29.66/100
- National rank
- #6465
- State rank
- #284 of 517 in CA
Livability — Stockton
- Score
- 57/100
- State rank
- #734
- US rank
- #21638
Category grades
Schools grade is shown separately in the Schools card above.
Census & demographics
- Census place
- Stockton, CA
- County
- San Joaquin County · 729,570 people
- City population
- 332,006
- Metro
- Stockton, CA
- Population (ZIP)
- 31,713
- Household income
- $112,268
- Rent vs Own
- Severe rent burden
- 825.0
Population outlook (San Joaquin County) Hauer SSP2
- Today (2025)
- 796,965 people
- By 2030
- 828,849 · +4.0%
- By 2040
- 885,611 · +11.1%
- By 2050
- 929,798 · +16.7%
- By 2075
- 994,578 · +24.8%
- By 2100
- 971,291 · +21.9%
Race, ethnicity, and origin ACS 2023
- Neighborhood character
- Highly diverse neighborhood (Simpson 0.75)
- Race & ethnicity
- White 33% Hispanic / Latino 30% Asian 21% Two or more races 18% Black 9%
- Hispanic origin (detail)
- Mexican 27%
- Common ancestry
- Slovak 2% Italian 2% Portuguese 1%
- Foreign-born
- 20% · Canada, China, Vietnam
- Languages at home
- 69% English-only · Spanish 14% Other Indo-European 4% Other Asian/Pacific 4%
Political lean MEDSL · San Joaquin
- 2024 margin
- Toss-up / Even · D 48.0% · R 48.9% · Other 3.0%
- 2008→2024 swing
- -11.6pp toward R · 2008: 10.7pp · 2024: -0.9pp
- All cycles
- 2024: R+0.9 2020: D+13.9 2016: D+12.9 2012: D+8.9 2008: D+10.7
Not yet ingested
- Civics
- —
Market trends
- HPI YoY
- ▲ 69.26%
- Current HPI
- 1122.61
- Rent YoY
- ▲ 4.16%
- Metro
- Stockton, CA
- State GDP YoY
- ▲ 3.21%
- F500 in state
- 116
Industry mix (Fortune 500 HQ in CA)
| Industry | F500 HQs | Revenue |
|---|---|---|
| Technology | 27 | $1,492B |
|
||
| Financial Services | 3 | $174B |
|
||
| Retail | 3 | $44B |
|
||
| Insurance | 3 | $26B |
|
||
| Media / Entertainment | 2 | $115B |
|
||
| Pharmaceuticals / Biotech | 2 | $62B |
|
||
Price history
1 event — show timeline
- 2002-07-09 Sold (Public Records) $270,000 Public Records
Property tax history
+0.7%/yrLatest (2025): $4,631 · +2.2% YoY. Source: county tax records.
Cash-flow waterfall
monthlySold comps — $/sqft
last 12 mo · ≤1 miLoading sold comps…