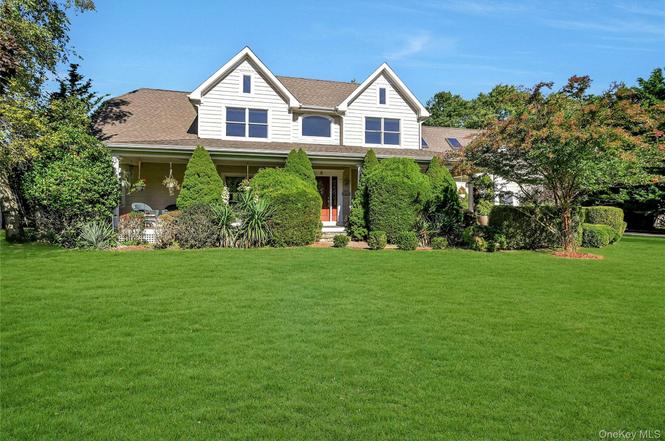
815 Uhl Ln
Orient, NY 11957
$1,450,000A-
4 bd · 3.5 ba ·
2,700 sqft ·
Built 2005
· SingleFamily
· Pending
· 166 DOM
Cashflow @ list (25.0% down · 7.5%)
Estimated rent
$50,000/mo
Mortgage (P&I)
−$7,604
Tax + insurance
−$1,508
HOA
−$0
Vac / Maint / Mgmt
−$10,500
Net cashflow
$30,388/mo
Annual
$364,658/yr
Cap rate
31.44%
Cash-on-cash
89.82%
DSCR
5.00
1% rule
3.45%
Cash to close
$406,000
Investor read
- This is a 4-bed/3.5-bath single-family listed at $1.45M.
- At list price, monthly cash flow is $30k ($365k/yr) — positive.
- The deal already cash-flows at list — no discount required.
- Meets the 1% rule at list price ($50k rent vs $1.45M).
- It's been on market 166 days — a 12% lower offer ($1.28M) is reasonable based on typical stale-listing flexibility.
- Recommended offer: $1.28M (12.0% below list) — sets the bar for market timing.
- In year one you build about $155k of equity ($10k loan paydown + $145k appreciation (10.0% local appreciation)).
- Location reads 57/100 on livability (#1,080 in NY) — a working-class tenant base; expect higher turnover. Strengths: crime A+, employment A+; Watch: amenities F, commute F, cost of living F.
- Oysterponds Union Free School District (rural): math 30% / reading 60% proficiency, ranked #506 of 755 in NY (top 67%) — families likely to look elsewhere, expect single-tenant / working-renter base with shorter leases; only 4% free/reduced lunch — higher-income household profile.
- Zoned schools: Oysterponds Elementary School (math 54% / reading 64%, grade B-, #745 of 2,108 statewide, top 39%, 80 students, 0% FRL) — zoned schools at 0% FRL track the district average.
- Zoned-school proficiency averages 60% at this address vs 45% district-wide (+14 pts) — the actual schools serving this property are materially stronger than the Oysterponds Union Free School District average implies; a family-tenant draw the district grade alone would hide.
- Market conditions: 25 active listings in the ZIP; 1 comparable units currently listed for rent nearby; 1,366 units permitted in Suffolk County in 2024 (216 in 5+ unit buildings).
- Suffolk County population projected to shrink 5% by 2050 — rents likely to lag national; underwrite the cash flow, not the appreciation.
- Current owner paid $170k; list at $1.45M implies a 753% gain — meaningful room to come down on a strong offer.
- At projected returns (10.0% appreciation + 3.0% rent growth), your $406k cash investment doubles in ~1 year — after that, you're playing with house money.
- By year 2, paydown + projected appreciation supports a ~$249k cash-out refi (75% LTV) — recoverable capital for the next deal without selling this one.
- Climate carrying-cost: severe wind risk, 80% chance of damaging wind over 30y; extreme-heat days projected 7→18/yr by 2055 (HVAC capex compounding) — expect insurance premiums to compound above CPI over the hold.
Questions for listing agent
- It's been on market 166 days. Have you received any prior offers? Is the seller open to a 12% concession, seller financing, or rate buy-down credit?
- Why hasn't it sold? Are there any deal-killer items the seller is aware of (foundation, flood, title, zoning, code violations)?
- Is there a deadline driving the sale (1031 exchange, divorce, estate, relocation)? That informs how much negotiation room exists.
- What's the average days-on-market for RENTAL listings here right now (not sales)? A rising rental-DOM trend means longer vacancies and softer asking-rent achievability than the comps imply.
- What's the recent tenant-quality profile in this submarket — average credit score on applications, eviction rate, late-payment / NSF rate, and stable-employment percentage? A property-management company in the area should have these aggregated.
- How much new for-sale + rental construction is in the pipeline within 1–3 miles? Heavy new supply typically softens prices + rents 12–24 months out; constrained supply supports both.
CashFlowRE · CFR-7C5DYDFZA7BKAN
· Data 3 weeks ago
cashflowre.app · 2026-05-29