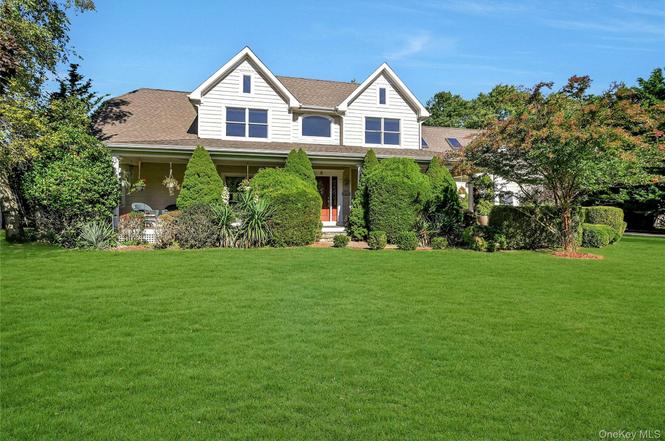
815 Uhl Ln · Orient, NY
Flood risk 1/10 · Minimal
- FEMA flood zone
- X (unshaded)
- Chance of flooding over 30 yrs
- 0.0%
- Est. flood insurance / yr
- $473 – $860
Fire risk 1/10 · Minimal
- Est. fire insurance / yr
- $691 – $1,283
Heat risk 5/10 · Moderate
- Hot days now (above 92°F)
- 7 days/yr
- Hot days in 30 yrs
- 18 days/yr
Wind risk 8/10 · Major
- Chance of severe wind over 30 yrs
- 80.0%
Air-quality risk 5/10 · Moderate
- Unhealthy air days now
- 6 days/yr
- Unhealthy air days in 30 yrs
- 8 days/yr
Risk factors via First Street. Map © Google.
Why this score? — see what drove the A- grade
The composite is a weighted blend of 9 inputs, each scored 0–100. Each bar is that input's sub-score; the figure is the points it added to the 100-point composite (weight × sub-score).
- Cash flow +30.0/30.0
- ARV discount +10.9/15.0
- 1% rule +10.0/10.0
- DSCR +10.0/10.0
- Appreciation +10.0/10.0
- Schools +4.3/10.0
- Livability +2.9/5.0
- Rent growth +2.5/5.0
- Condition / age +2.5/5.0
$1,450,000
🖨 Deal sheet 📄 Offer letter ✓ Due diligence
Listing remarks
Orient By The Sea — Sound front community with a deeded association beach and park. Two story, 4 bedroom, 3 1/2 bathroom Nantucket style residence in sought-after Orient By-The-Sea. Perfect for year-round or vacation living. Covered mahogany wrap porch welcomes you to this light, open and spacious home that is perfect for entertaining, holiday gatherings, and cozy family time. Living room, great room, formal dining room, large kitchen with informal dining area. Wooden floors, light-filled. Great room has a vaulted ceiling and floor to ceiling gas stone fireplace and hearth, huge windows and transoms. Great room opens to gracious rear covered porch with ceiling fan and skylights, provi
Key facts
- Balcony walkway
- Level rear yard
- 0.94 acre lot
Tags
Neighborhood map
What this means for you Summary
Snapshot
- This is a 4-bed/3.5-bath single-family listed at $1.45M.
Deal economics
- At list price, monthly cash flow is $30k ($365k/yr) — positive.
- The deal already cash-flows at list — no discount required.
- Meets the 1% rule at list price ($50k rent vs $1.45M).
- Recommended offer: $1.28M (12.0% below list) — sets the bar for market timing.
Location & tenants
- Location reads 57/100 on livability (#1,080 in NY) — a working-class tenant base; expect higher turnover. Strengths: crime A+, employment A+; Watch: amenities F, commute F, cost of living F.
- Oysterponds Union Free School District (rural): math 30% / reading 60% proficiency, ranked #506 of 755 in NY (top 67%) — families likely to look elsewhere, expect single-tenant / working-renter base with shorter leases; only 4% free/reduced lunch — higher-income household profile.
- Zoned schools: Oysterponds Elementary School (math 54% / reading 64%, grade B-, #745 of 2,108 statewide, top 39%, 80 students, 0% FRL) — zoned schools at 0% FRL track the district average.
- Zoned-school proficiency averages 60% at this address vs 45% district-wide (+14 pts) — the actual schools serving this property are materially stronger than the Oysterponds Union Free School District average implies; a family-tenant draw the district grade alone would hide.
- Market conditions: 25 active listings in the ZIP; 1 comparable units currently listed for rent nearby; 1,366 units permitted in Suffolk County in 2024 (216 in 5+ unit buildings).
Forward outlook
- In year one you build about $155k of equity ($10k loan paydown + $145k appreciation (10.0% local appreciation)).
- Suffolk County population projected to shrink 5% by 2050 — rents likely to lag national; underwrite the cash flow, not the appreciation.
- At projected returns (10.0% appreciation + 3.0% rent growth), your $406k cash investment doubles in ~1 year — after that, you're playing with house money.
- By year 2, paydown + projected appreciation supports a ~$249k cash-out refi (75% LTV) — recoverable capital for the next deal without selling this one.
Negotiation context
- It's been on market 166 days — a 12% lower offer ($1.28M) is reasonable based on typical stale-listing flexibility.
- Current owner paid $170k; list at $1.45M implies a 753% gain — meaningful room to come down on a strong offer.
Risks & watch-outs
- Climate carrying-cost: severe wind risk, 80% chance of damaging wind over 30y; extreme-heat days projected 7→18/yr by 2055 (HVAC capex compounding) — expect insurance premiums to compound above CPI over the hold.
Questions for the listing agent
- It's been on market 166 days. Have you received any prior offers? Is the seller open to a 12% concession, seller financing, or rate buy-down credit?
- Why hasn't it sold? Are there any deal-killer items the seller is aware of (foundation, flood, title, zoning, code violations)?
- Is there a deadline driving the sale (1031 exchange, divorce, estate, relocation)? That informs how much negotiation room exists.
- What's the average days-on-market for RENTAL listings here right now (not sales)? A rising rental-DOM trend means longer vacancies and softer asking-rent achievability than the comps imply.
- What's the recent tenant-quality profile in this submarket — average credit score on applications, eviction rate, late-payment / NSF rate, and stable-employment percentage? A property-management company in the area should have these aggregated.
- How much new for-sale + rental construction is in the pipeline within 1–3 miles? Heavy new supply typically softens prices + rents 12–24 months out; constrained supply supports both.
Investment metrics
- 1% rule
- 3.45% ✓
- Cap rate
- 31.44%
- Cash-on-cash
- 89.82%
- DSCR
- 5.00
- GRM
- 2.4
CMA / ARV
- ARV (on-the-fly)
- $1,568,700
- Comps found
- 5
Show comp detail 5 sales within ~0.75 mi
| Address | Dist | Beds/Ba | Sqft | Sold | Price | $/sf | Match |
|---|---|---|---|---|---|---|---|
| 815 Uhl Ln | 0.00mi | 4/3.5 | 2,700 (0%) | 0mo | $1,450,000 | $537 | 100 |
| 555 Three Waters Ln | 0.15mi | 3/3.0 (-1) | 2,400 (-11%) | 8mo | $1,010,000 | $421 | 61 |
| 1300 Parkview Ln | 0.14mi | 4/2.5 | 2,400 (-11%) | 16mo | $1,395,000 | $581 | 58 |
| 125 Soundview Rd | 0.22mi | 4/3.5 | 2,950 (+9%) | 21mo | $2,899,000 | $983 | 57 |
| 1855 Greenway East | 0.44mi | 5/4.5 (+1) | 2,950 (+9%) | 9mo | $1,775,000 | $602 | 47 |
Match score weights: distance 35% · size 25% · config 20% · recency 20%. Top-matched comps best support the ARV.
Projected returns pro-forma
10.0% appreciation · 3.0% rent growth · sell at horizon
- IRR
- 98.9%
- Equity multiple
- 7.71×
- Total profit
- $2,725,343
- Equity at exit
- $1,306,275
- IRR
- 94.2%
- Equity multiple
- 17.02×
- Total profit
- $6,504,061
- Equity at exit
- $2,817,031
Cash invested: $406,000 (down + closing). Projections, not guarantees.
Landlord ↔ Tenant lean methodology
- Overall (STATE)
- 15 Strongly Tenant-Friendly
- State New York
- 15 Strongly Tenant-Friendly · D+10
- County
- — inherits STATE
- City
- — inherits STATE
ZIP-level market 11957
- Home prices YoY
- 6.6%
- Active inventory
- 25
- Price-to-rent
- 2.4×
Monthly cashflow live
- Estimated rent
- $50,000 medium interval (Pro) →
- Mortgage (P&I)
- −$7,604
- Tax from tax record
- −$904 /mo · $10,844/yr
- Insurance
- −$604
- HOA
- −$0
- Vacancy / Maint / Mgmt
- −$10,500
- Net cashflow
- $30,388
Break-even live
UW: 25.0% down · 7.5% · 30yr · 1.5% tax · 5.0% vac · 8.0% maint · 8.0% mgmt
Financing live
Cash to close
- Down payment
- $362,500
- Closing costs
- $43,500
- Reserves months
- —
- Total cash needed
- —
Loan-product check · same deal, 3 products live
Conventional
25% down · 7.5% · 30yr
- Down + closing
- —
- Monthly P&I
- —
- Monthly cashflow
- —
- DSCR
- —
- Eligible?
- —
Personal DTI + credit; lowest rate.
DSCR
20% down · 8.5% · 30yr
- Down + closing
- —
- Monthly P&I
- —
- Monthly cashflow
- —
- DSCR
- —
- Eligible?
- —
No personal income docs; deal must DSCR.
Hard money
10% down · 12.0% · 12mo
- Down + closing
- —
- Monthly P&I
- —
- Monthly cashflow
- —
- DSCR
- —
- Eligible?
- —
Short-term bridge; refi at stabilization.
Rent comps 1 comps
| Address | Beds | Baths | Sqft | Rent | $/sqft | DOM | Units | Dist |
|---|---|---|---|---|---|---|---|---|
| 505 Plum Island Ln Orient, NY | 4.0 | 4.5 | 2600 | $50,000 | $19.23 | 44d | 1 | 0.11mi |
Listing history 3 events
-
2026-04-22status Pending
-
2025-11-06$1,450,000 Active
-
2002-10-16soldstatus $170,000
ⓘ Source: listings_history table (triggers on properties + properties_extension) + one-shot
backfill from property_details.listing_events for pre-trigger history.
Tax reassessment forecast NY · Partial reset (capped growth)
- Current annual tax
- $10,844 · $904/mo
- Projected year-2 tax
- $17,675 · $1,473/mo
- Expected delta
- +$6,830/yr (+$569/mo · 63.0%)
ⓘ Screening estimate from a state-policy table — verify with the county assessor before closing.
Climate risk First Street
- Flood 1/10 Low FEMA zone X (unshaded) · 0% chance over 30 yrs
- Wildfire 1/10 Low
- Heat 5/10 Major 7 d/yr ≥92°F today · 18 d/yr by 30 yrs out
- Wind 8/10 Severe 80% chance of damaging wind over 30 yrs
- Air quality 5/10 Major 6 unhealthy d/yr today · 8 by 30 yrs out
Nearby sold comps map
Loading sold comps map…
Walkable amenities ~0.75 mi
Loading nearby amenities…
Taxation est. · year 1
- Rental income
- $600,000
- − Mortgage interest
- −$81,223
- − Property taxes
- −$10,844
- − Insurance
- −$7,250
- − Repairs & maintenance
- −$48,000
- − Management
- −$48,000
- − Depreciation
- −$42,182
- Taxable income
- $362,501
- Est. tax owed @ 24.0%
- −$87,000
- After-tax cash flow
- $277,658/yr
For passive investors: Depreciation is non-cash, so a rental often shows a tax loss while cash-flowing — sheltering income. Rental losses are passive: they offset passive income freely, and up to $25,000/yr can offset ordinary (W-2) income if you actively participate and your MAGI is under $100k (phasing out to $0 by $150k); unused losses carry forward. On sale, claimed depreciation is recaptured at up to 25%, and gains may owe capital-gains tax (a 1031 exchange can defer both). Figures are a year-1 estimate at your 24.0% rate — not tax advice; consult a CPA.
Schools (NCES district)
- District
- Oysterponds Union Free School District
- NCES district ID
- 3621930
- Math proficiency
- 30% ▼ -10.00%
- Reading proficiency
- 60% ▲ 20.00%
- Median HH income
- $71,948
- Composite
- 42.9/100
- National rank
- #6712
- State rank
- #506 of 755 in NY
Livability — Orient
- Score
- 57/100
- State rank
- #1080
- US rank
- #21725
Category grades
Schools grade is shown separately in the Schools card above.
Census & demographics
- Census place
- Orient, NY
- Population (ZIP)
- 1,152
Population outlook (Suffolk County) Hauer SSP2
- Today (2025)
- 1,505,262 people
- By 2030
- 1,498,318 · -0.5%
- By 2040
- 1,471,101 · -2.3%
- By 2050
- 1,424,848 · -5.3%
- By 2075
- 1,337,157 · -11.2%
- By 2100
- 1,217,720 · -19.1%
Race, ethnicity, and origin ACS 2023
- Neighborhood character
- Predominantly White (96%)
- Race & ethnicity
- White 96% Hispanic / Latino 2%
- Common ancestry
- Romanian 5% Scotch-Irish 3% Iranian 3%
- Foreign-born
- 17% · Canada, China
- Languages at home
- 85% English-only · Other Asian/Pacific 5% Russian/Polish/Slavic 3% Other Indo-European 2%
Political lean MEDSL · Suffolk
- 2024 margin
- Lean R (+10.0) · D 45.0% · R 55.0%
- 2008→2024 swing
- -16.0pp toward R · 2008: 6.0pp · 2024: -10.0pp
- All cycles
- 2024: R+10.0 2020: R+0.0 2016: R+8.2 2012: D+2.9 2008: D+6.0
Not yet ingested
- Civics
- —
Market trends
- HPI YoY
- ▲ 16.41%
- Current HPI
- 265.16
- Rent YoY
- —
- Metro
- —
- State GDP YoY
- ▲ 2.60%
- F500 in state
- 92
Industry mix (Fortune 500 HQ in NY)
| Industry | F500 HQs | Revenue |
|---|---|---|
| Financial Services | 10 | $950B |
|
||
| Consumer Goods | 9 | $162B |
|
||
| Insurance | 4 | $225B |
|
||
| Telecommunications | 2 | $144B |
|
||
| Pharmaceuticals | 2 | $112B |
|
||
| Media / Entertainment | 2 | $69B |
|
||
Price history
+752.9% since first listed3 events — show timeline
- 2026-04-22 Pending — OneKey® MLS as Distributed by MLS Grid
- 2025-11-06 Listed $1,450,000 OneKey® MLS as Distributed by MLS Grid
- 2002-10-16 Sold (Public Records) $170,000 Public Records
Property tax history
+1.4%/yrLatest (2025): $10,844 · +0.0% YoY. Source: county tax records.
Cash-flow waterfall
monthlySold comps — $/sqft
last 12 mo · ≤1 miLoading sold comps…