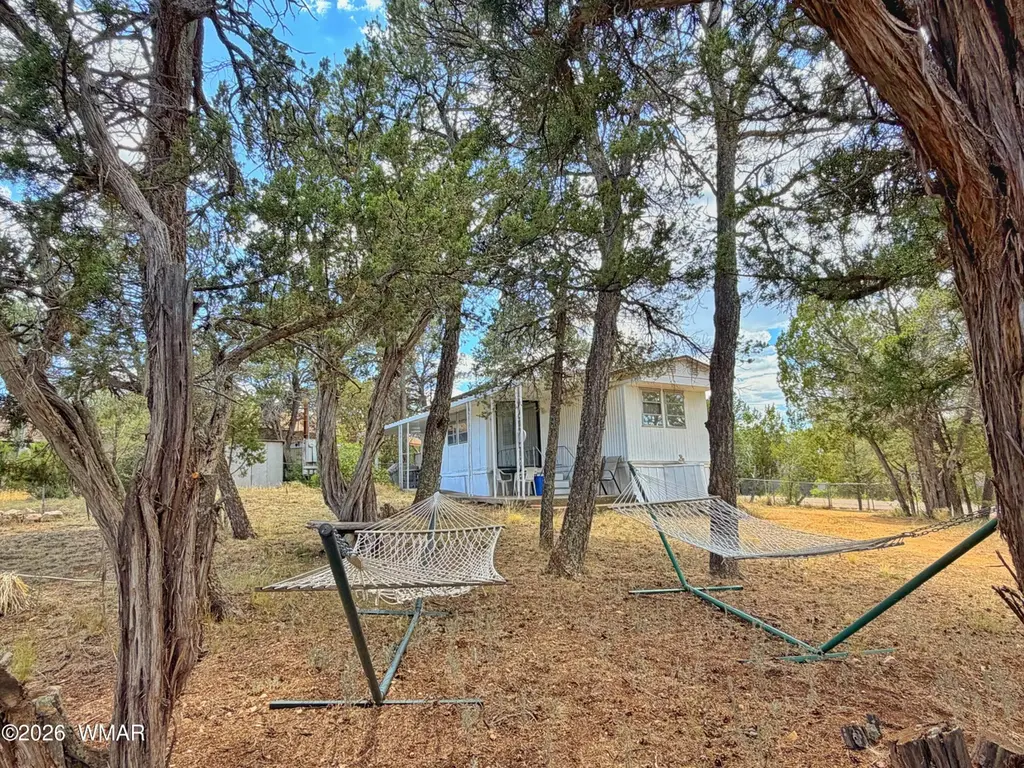
3405 Buckhorn Bend Rd
Heber-Overgaard, AZ 85933
$150,000D
1 bd · 1.0 ba ·
550 sqft ·
Built 1965
· Manufactured
· Active
· 12 DOM
Cashflow @ list (25.0% down · 7.5%)
Estimated rent
$1,374/mo
Mortgage (P&I)
−$787
Tax + insurance
−$250
HOA
−$0
Vac / Maint / Mgmt
−$288
Net cashflow
$49/mo
Annual
$583/yr
Cap rate
6.68%
Cash-on-cash
1.39%
DSCR
1.06
1% rule
0.92%
Cash to close
$42,000
Investor read
- This is a 1-bed/1.0-bath manufactured listed at $150k.
- At list price, monthly cash flow is $49 ($583/yr) — positive.
- The deal already cash-flows at list — no discount required.
- To meet the 1% rule (rent ≥ 1% of price), the offer needs to be $137k (8.4% below list).
- Only 12 days on market — expect competitive offers; lowballing is unlikely to land.
- Recommended offer: $137k (8.4% below list) — sets the bar for 1% rule.
- Local home prices are declining (-3.0%/yr); year-one equity from $1k of loan paydown is wiped out by about $4k of value loss. Plan a longer hold.
- Location reads: area grade D — affects rentability + tenant quality, not the cash-flow math above.
- Heber-Overgaard Unified District (4392) (rural): math 52% / reading 45% proficiency, ranked #51 of 249 in AZ (top 20%) — families likely to look elsewhere, expect single-tenant / working-renter base with shorter leases.
- Zoned schools: Mountain Meadows Primary (math 70% / reading 50%, grade B-, #148 of 1,109 statewide, top 15%, 143 students, 43% FRL); Mogollon Jr High School (math 42% / reading 32%, grade F, #57 of 218 statewide, top 27%, 77 students, 0% FRL); Mogollon High School (math 30% / reading 30%, grade F, #116 of 381 statewide, top 31%, 167 students, 32% FRL) — zoned schools average 25% FRL vs 50% district-wide (25 pts lower); this property's tenant base skews higher-income than the district average.
- Market conditions: 258 active listings in the ZIP; 485 units permitted in Navajo County in 2024 (11 in 5+ unit buildings).
- Navajo County population projected at -16% by 2050 — secular population decline; favor cash flow + early exit over multi-decade hold.
- 3 sale attempts since 2y ago with the ask held roughly flat each time — persistent listings suggest the price (not the market) is what's stuck; bring a comps-based counter.
- Current owner paid $60k; list at $150k implies a 150% gain — meaningful room to come down on a strong offer.
- Climate carrying-cost: major wildfire risk — expect insurance premiums to compound above CPI over the hold.
- Cap rate 6.7% vs local median 3.2% in Heber-Overgaard — top-decile yield for the area; either an underpriced asset or a hidden risk that comps aren't pricing in. Stress-test before assuming the spread holds.
Questions for listing agent
- Built in 1965 — when were the roof, HVAC, electrical panel, plumbing, and water heater last replaced?
- Is there a deadline driving the sale (1031 exchange, divorce, estate, relocation)? That informs how much negotiation room exists.
- The area grade is low — what's the realistic commute time and amenity access for the typical tenant pool here? Any planned neighborhood developments (good or bad) we should know about?
- What's the average days-on-market for RENTAL listings here right now (not sales)? A rising rental-DOM trend means longer vacancies and softer asking-rent achievability than the comps imply.
- What's the recent tenant-quality profile in this submarket — average credit score on applications, eviction rate, late-payment / NSF rate, and stable-employment percentage? A property-management company in the area should have these aggregated.
- How much new for-sale + rental construction is in the pipeline within 1–3 miles? Heavy new supply typically softens prices + rents 12–24 months out; constrained supply supports both.
CashFlowRE · CFR-7C6YBND93KX9SP
· Data 6 h ago
cashflowre.app · 2026-05-29