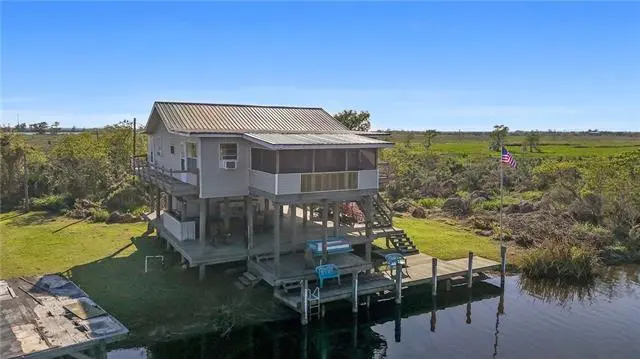
0 North Pass Manchac
Ponchatoula, LA 70454
$189,000D
3 bd · 3.0 ba ·
1,500 sqft ·
Built 2016
· Land
· Pending
· 27 DOM
Cashflow @ list (25.0% down · 7.5%)
Estimated rent
$1,712/mo
Mortgage (P&I)
−$991
Tax + insurance
−$984
HOA
−$0
Vac / Maint / Mgmt
−$360
Net cashflow
$-623/mo
Annual
$-7,470/yr
Cap rate
6.59%
Cash-on-cash
1.05%
DSCR
1.05
1% rule
0.91%
Cash to close
$52,920
Investor read
- This is a 3-bed/3.0-bath land listed at $189k.
- At list price, monthly cash flow is $-623 ($-7k/yr) — negative.
- To cash-flow at today's rent, offer at most $99k (47.7% below list).
- To meet the 1% rule (rent ≥ 1% of price), the offer needs to be $171k (9.4% below list).
- It's been on market 27 days — a 2% lower offer ($186k) is reasonable based on typical stale-listing flexibility.
- Recommended offer: $99k (47.7% below list) — sets the bar for cash-flow.
- Local home prices are declining (-3.0%/yr); year-one equity from $1k of loan paydown is wiped out by about $6k of value loss. Plan a longer hold.
- Location reads 68/100 on livability (#91 in LA) — a middle-class / working-renter tenant base. Strengths: cost of living A+, health & safety A+, housing A-; Watch: employment D, crime D-, amenities F.
- Tangipahoa Parish (rural): math 18% / reading 29% proficiency, ranked #63 of 98 in LA (top 64%) — low school quality limits family demand, transient renter base, plan for 1-2y turnover; 73% free/reduced lunch — lower-income household profile, screen leases tightly.
- Watch-outs: flood insurance adds $669/mo.
- Market conditions: Rents flat; 526 active listings in the ZIP; 1,085 units permitted in Tangipahoa Parish in 2024 (378 in 5+ unit buildings).
- Tangipahoa County population projected at +22% by 2050 — long-run rental-demand tailwind backs the buy-and-hold thesis.
- 2 sale attempts with the ask held roughly flat each time — persistent listings suggest the price (not the market) is what's stuck; bring a comps-based counter.
- Current owner paid $6k; list at $189k implies a 3050% gain — meaningful room to come down on a strong offer.
- Climate carrying-cost: in FEMA flood zone VE (mandatory federal flood insurance); severe wind risk, 99% chance of damaging wind over 30y; moderate wildfire risk; extreme-heat days projected 7→21/yr by 2055 (HVAC capex compounding) — expect insurance premiums to compound above CPI over the hold.
- Cap rate 6.6% vs local median 5.1% in Ponchatoula — meaningfully above typical; check what's discounted (condition, days-on-market, listing class) to confirm the premium yield is real.
Questions for listing agent
- What do current leases actually rent for vs. the listed asking? Can we see a recent rent roll and the last 12 months of T-12 income?
- What's the actual annual flood-insurance premium (NFIP or private), and is the property in a SFHA with mandatory coverage?
- Is there a deadline driving the sale (1031 exchange, divorce, estate, relocation)? That informs how much negotiation room exists.
- Schools are B-rated — typically a magnet for longer-tenancy family renters. What's the average tenant stay here, and is there a school-zone premium baked into asking?
- Crime grade is D in this area — have there been break-ins, vandalism, or insurance claims at this property in the last 3 years? What carrier currently insures it and at what premium?
- The area grade is low — what's the realistic commute time and amenity access for the typical tenant pool here? Any planned neighborhood developments (good or bad) we should know about?
- What's the average days-on-market for RENTAL listings here right now (not sales)? A rising rental-DOM trend means longer vacancies and softer asking-rent achievability than the comps imply.
- What's the recent tenant-quality profile in this submarket — average credit score on applications, eviction rate, late-payment / NSF rate, and stable-employment percentage? A property-management company in the area should have these aggregated.
CashFlowRE · CFR-7FVT4D2BCEQH3H
· Data 1 week ago
cashflowre.app · 2026-05-29