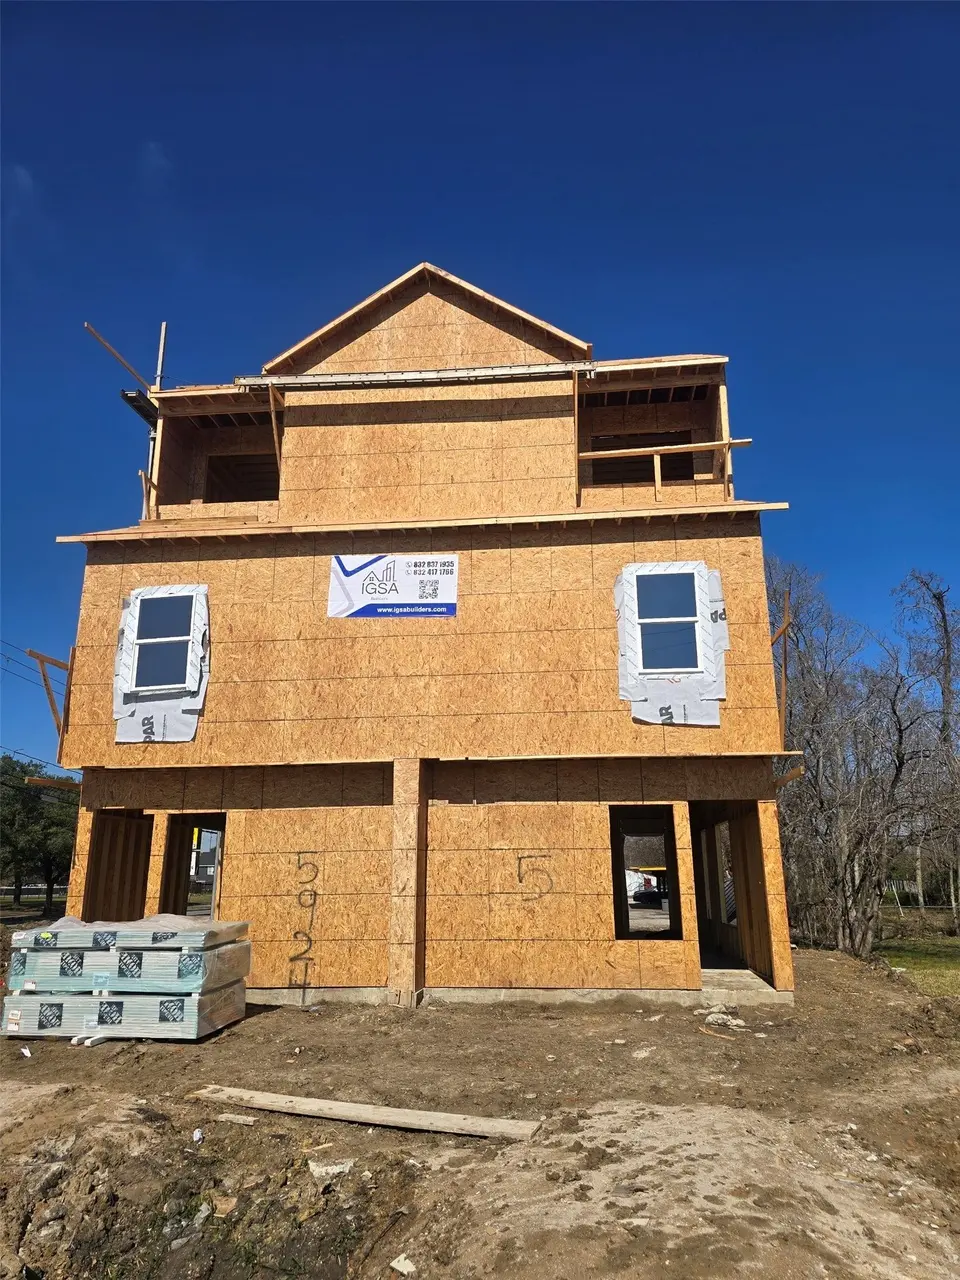
5924 N Wayside Dr Unit A-B
Houston, TX 77028
$459,900D-
6 bd · 5.0 ba ·
2,469 sqft ·
Built 2026
· MultiFamily
· Active
· 141 DOM
Cashflow @ list (25.0% down · 7.5%)
Estimated rent
$3,544/mo
Mortgage (P&I)
−$2,412
Tax + insurance
−$766
HOA
−$0
Vac / Maint / Mgmt
−$744
Net cashflow
$-379/mo
Annual
$-4,542/yr
Cap rate
5.31%
Cash-on-cash
-3.53%
DSCR
0.84
1% rule
0.77%
Cash to close
$128,772
Investor read
- This is a 2 × 3.0-bed/2.5-bath units multifamily listed at $460k.
- At list price, monthly cash flow is $-379 ($-5k/yr) — negative. Per door: $-189/mo.
- To cash-flow at today's rent, offer at most $405k (11.9% below list).
- To meet the 1% rule (rent ≥ 1% of price), the offer needs to be $354k (22.9% below list).
- It's been on market 141 days — a 12% lower offer ($405k) is reasonable based on typical stale-listing flexibility.
- Recommended offer: $354k (22.9% below list) — sets the bar for 1% rule.
- In year one you build about $27k of equity ($3k loan paydown + $24k appreciation (5.2% local appreciation)).
- Location reads 74/100 on livability (#184 in TX, #4,771 nationally) — a middle-class / working-renter tenant base. Strengths: amenities A+, cost of living A+, housing A+; Watch: schools D, crime F.
- Houston ISD (urban): math 27% / reading 35% proficiency, ranked #593 of 826 in TX (top 72%) — families likely to look elsewhere, expect single-tenant / working-renter base with shorter leases; 71% free/reduced lunch — lower-income household profile, screen leases tightly.
- Market conditions: Rents soft (-1.6%/yr); 353 active listings in the ZIP; lower-income renter base — watch delinquency; 29,883 units permitted in Harris County in 2024 (8,621 in 5+ unit buildings).
- Harris County population projected at +47% by 2050 — long-run rental-demand tailwind backs the buy-and-hold thesis.
- By year 2, paydown + projected appreciation supports a ~$44k cash-out refi (75% LTV) — recoverable capital for the next deal without selling this one.
- Cap rate 5.3% vs local median 3.1% in Houston — top-decile yield for the area; either an underpriced asset or a hidden risk that comps aren't pricing in. Stress-test before assuming the spread holds.
- At $3,544/mo this rent would consume 111% of the median local household income ($38k/yr) (locally 1177% of renters already pay >50% of income on rent) — very limited rent-growth headroom before tenants either downsize or default.
Questions for listing agent
- What do current leases actually rent for vs. the listed asking? Can we see a recent rent roll and the last 12 months of T-12 income?
- It's been on market 141 days. Have you received any prior offers? Is the seller open to a 23% concession, seller financing, or rate buy-down credit?
- Can we see the unit-by-unit rent roll, current vacancy, and any below-market leases? What's the average tenancy length?
- What capital expenditures (roof, boiler, parking lot, exteriors) have been made in the last 5 years, and what's planned in the next 2?
- Why hasn't it sold? Are there any deal-killer items the seller is aware of (foundation, flood, title, zoning, code violations)?
- Is there a deadline driving the sale (1031 exchange, divorce, estate, relocation)? That informs how much negotiation room exists.
- Schools are D-rated, which usually means shorter tenancies and higher turnover. Who's the typical renter profile here, and what's been the actual vacancy rate?
- Crime grade is F in this area — have there been break-ins, vandalism, or insurance claims at this property in the last 3 years? What carrier currently insures it and at what premium?
CashFlowRE · CFR-7G3Z897K2VMNSE
· Data 3 days ago
cashflowre.app · 2026-05-29