 Duplex
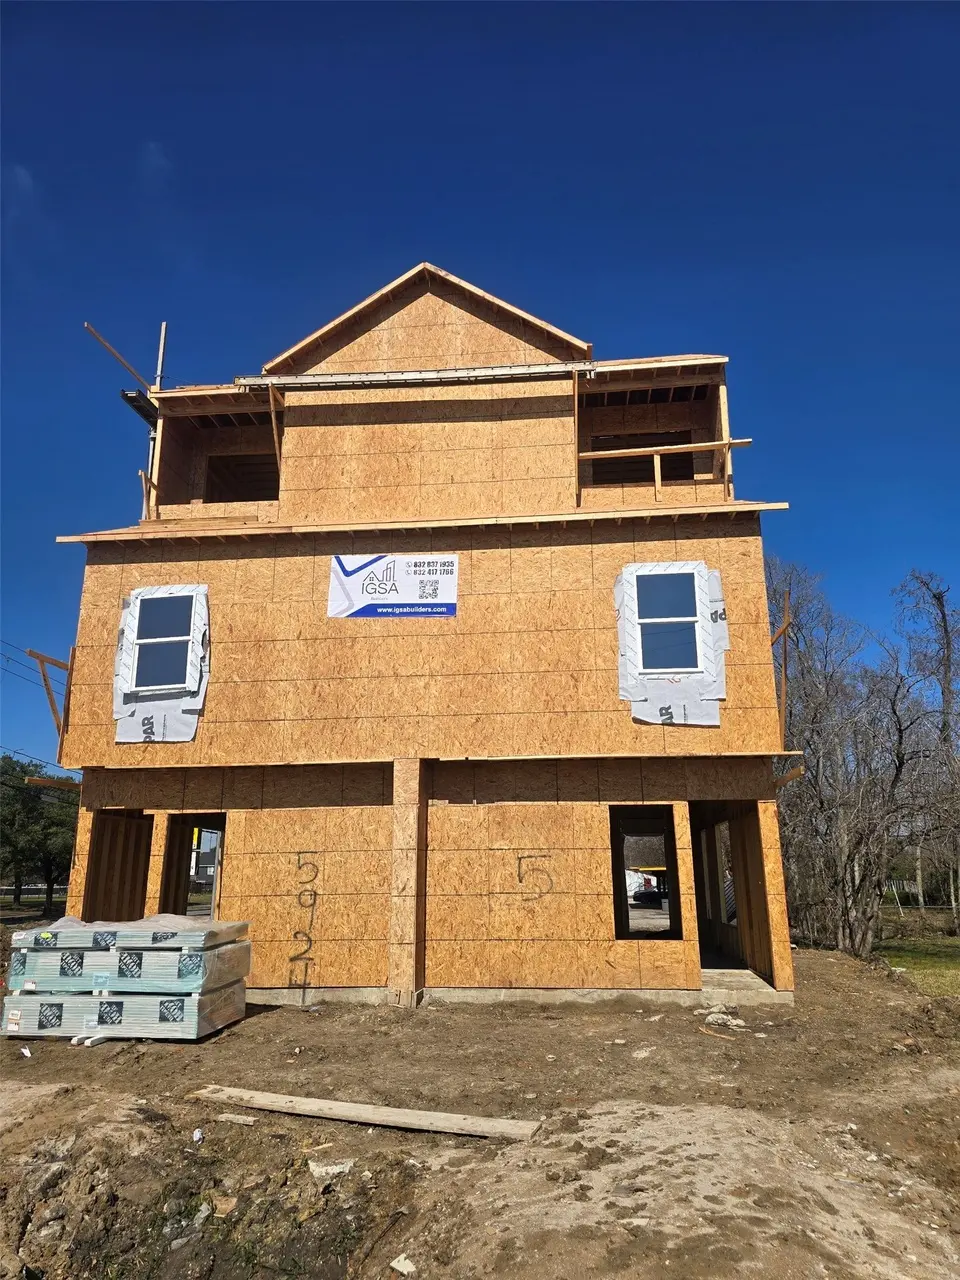
5924 N Wayside Dr Unit A-B · Houston, TX
Flood risk No data
- FEMA flood zone
- —
- Chance of flooding over 30 yrs
- —
- Est. flood insurance / yr
- —
Fire risk No data
- Est. fire insurance / yr
- —
Heat risk No data
- Hot days now (above threshold)
- —
- Hot days in 30 yrs
- —
Wind risk No data
- Chance of severe wind over 30 yrs
- —
Air-quality risk No data
- Unhealthy air days now
- —
- Unhealthy air days in 30 yrs
- —
Risk factors via First Street. Map © Google.
Why this score? — see what drove the D- grade
The composite is a weighted blend of 9 inputs, each scored 0–100. Each bar is that input's sub-score; the figure is the points it added to the 100-point composite (weight × sub-score).
- Cash flow +8.8/30.0
- Appreciation +7.6/10.0
- ARV discount +6.2/15.0
- Livability +3.7/5.0
- 1% rule +2.7/10.0
- Schools +2.7/10.0
- Condition / age +2.5/5.0
- DSCR +2.4/10.0
- Rent growth +2.1/5.0
$459,900
🖨 Deal sheet (PDF) 📄 Offer letter ✓ Due diligence
Multi-family units
County records classify this as Multi-Family (2-4 Unit). Listing-text estimate: 2 units. confirmed
Listing remarks MLS
Experience the perfect blend of contemporary design and functional urban living with this stunning new construction 3 bedrooms and 2.5 bathrooms duplex coming soon! This architectural gem features two distinct units, each thoughtfully designed to span all three levels, providing a vertical living experience that maximizes privacy and space. The exterior boasts a sophisticated mix of modern finishes. Large, strategically placed windows throughout ensure each floor is bathed in natural light, creating an airy and inviting atmosphere from the ground up. Whether you are looking for a savvy investment property or a multi-generational living solution, these residences provide the flexibility and style demanded by the modern Houstonian. Located in a growing pocket of the city, this duplex represents a rare chance to own a piece of high-density, high-design real estate that doesn't compromise on curb appeal or structural integrity. Schedule your showing today!
Key facts
- Large windows
- Three levels
- Natural light
Tags
Neighborhood map
What this means for you Summary
Snapshot
- This is a 2 × 3.0-bed/2.5-bath units multifamily listed at $460k.
Deal economics
- At list price, monthly cash flow is $-379 ($-5k/yr) — negative. Per door: $-189/mo.
- To cash-flow at today's rent, offer at most $405k (11.9% below list).
- To meet the 1% rule (rent ≥ 1% of price), the offer needs to be $354k (22.9% below list).
- Recommended offer: $354k (22.9% below list) — sets the bar for 1% rule.
- Cap rate 5.3% vs local median 3.1% in Houston — top-decile yield for the area; either an underpriced asset or a hidden risk that comps aren't pricing in. Stress-test before assuming the spread holds.
Location & tenants
- Location reads 74/100 on livability (#184 in TX, #4,771 nationally) — a middle-class / working-renter tenant base. Strengths: amenities A+, cost of living A+, housing A+; Watch: schools D, crime F.
- Houston ISD (urban): math 27% / reading 35% proficiency, ranked #593 of 826 in TX (top 72%) — families likely to look elsewhere, expect single-tenant / working-renter base with shorter leases; 71% free/reduced lunch — lower-income household profile, screen leases tightly.
- Market conditions: Rents soft (-1.6%/yr); 353 active listings in the ZIP; lower-income renter base — watch delinquency; 29,883 units permitted in Harris County in 2024 (8,621 in 5+ unit buildings).
- At $3,544/mo this rent would consume 111% of the median local household income ($38k/yr) (locally 1177% of renters already pay >50% of income on rent) — very limited rent-growth headroom before tenants either downsize or default.
Forward outlook
- In year one you build about $27k of equity ($3k loan paydown + $24k appreciation (5.2% local appreciation)).
- Harris County population projected at +47% by 2050 — long-run rental-demand tailwind backs the buy-and-hold thesis.
- By year 2, paydown + projected appreciation supports a ~$44k cash-out refi (75% LTV) — recoverable capital for the next deal without selling this one.
Negotiation context
- It's been on market 141 days — a 12% lower offer ($405k) is reasonable based on typical stale-listing flexibility.
Questions for the listing agent
- What do current leases actually rent for vs. the listed asking? Can we see a recent rent roll and the last 12 months of T-12 income?
- It's been on market 141 days. Have you received any prior offers? Is the seller open to a 23% concession, seller financing, or rate buy-down credit?
- Can we see the unit-by-unit rent roll, current vacancy, and any below-market leases? What's the average tenancy length?
- What capital expenditures (roof, boiler, parking lot, exteriors) have been made in the last 5 years, and what's planned in the next 2?
- Why hasn't it sold? Are there any deal-killer items the seller is aware of (foundation, flood, title, zoning, code violations)?
- Is there a deadline driving the sale (1031 exchange, divorce, estate, relocation)? That informs how much negotiation room exists.
- Schools are D-rated, which usually means shorter tenancies and higher turnover. Who's the typical renter profile here, and what's been the actual vacancy rate?
- Crime grade is F in this area — have there been break-ins, vandalism, or insurance claims at this property in the last 3 years? What carrier currently insures it and at what premium?
- The area grade is low — what's the realistic commute time and amenity access for the typical tenant pool here? Any planned neighborhood developments (good or bad) we should know about?
- What's the average days-on-market for RENTAL listings here right now (not sales)? A rising rental-DOM trend means longer vacancies and softer asking-rent achievability than the comps imply.
- What's the recent tenant-quality profile in this submarket — average credit score on applications, eviction rate, late-payment / NSF rate, and stable-employment percentage? A property-management company in the area should have these aggregated.
- How much new apartment / multifamily construction is in the pipeline within 1–3 miles? Heavy new supply (>2% of stock underway) typically softens rents 12–24 months out; light construction supports rent growth.
Investment metrics
- 1% rule
- 0.77% ✗
- Cap rate
- 5.31%
- Cash-on-cash
- -3.53%
- DSCR
- 0.84
- GRM
- 10.8
CMA / ARV
- ARV (median comp)
- $447,058
- List price
- $459,900
- Delta
- 2.87%
- Verdict
- FAIR
- Comps
- 20 within 1.0 mi
Show comp detail 5 sales within ~0.75 mi
| Address | Dist | Beds/Ba | Sqft | Sold | Price | $/sf | Match |
|---|---|---|---|---|---|---|---|
| 6112 Fairchild St | 0.12mi | 6/2.0 | 2,452 (-1%) | 14mo | $412,000 | $168 | 69 |
| 7830 Booker Street A-b | 0.49mi | 6/— | 2,524 (+2%) | 15mo | $447,500 | $177 | 61 |
| 7709 St Louis St | 0.29mi | 6/2.0 | 2,545 (+3%) | 18mo | $405,500 | $159 | 54 |
| 7921 Bonaire St Unit A and B | 0.34mi | 6/2.0 | 2,581 (+4%) | 17mo | $465,000 | $180 | 50 |
| 7815 Joy St | 0.68mi | 6/2.0 | 2,577 (+4%) | 12mo | $399,900 | $155 | 39 |
Match score weights: distance 35% · size 25% · config 20% · recency 20%. Top-matched comps best support the ARV.
Projected returns pro-forma
5.25% appreciation · 0.0% rent growth · sell at horizon
- IRR
- 9.4%
- Equity multiple
- 1.61×
- Total profit
- $78,020
- Equity at exit
- $267,491
- IRR
- 10.0%
- Equity multiple
- 2.83×
- Total profit
- $236,167
- Equity at exit
- $467,437
Cash invested: $128,772 (down + closing). Projections, not guarantees.
Landlord ↔ Tenant lean methodology
- Overall (STATE)
- 87 Strongly Landlord-Friendly
- State Texas
- 87 Strongly Landlord-Friendly · R+5
- County
- — inherits STATE
- City
- — inherits STATE
ZIP-level market 77028
- Home prices YoY
- 2.0%
- Rents YoY
- -1.6%
- Active inventory
- 353
- Price-to-rent
- 21.6×
Monthly cashflow live
- Estimated rent
- $3,544 high interval (Pro) →
- Mortgage (P&I)
- −$2,412
- Tax est. 1.5%
- −$575 /mo · $6,898/yr
- Insurance
- −$192
- HOA
- −$0
- Vacancy / Maint / Mgmt
- −$744
- Net cashflow
- $-379
Break-even live
Sensitivity live
| Price | -10% $-61 | -5% $-220 | +0% $-379 | +5% $-537 | +10% $-696 |
|---|---|---|---|---|---|
| Rent | -10% $-658 | -5% $-518 | +0% $-379 | +5% $-239 | +10% $-99 |
| Rate | -1.0pp $-147 | -0.5pp $-262 | base $-379 | +0.5pp $-498 | +1.0pp $-619 |
2-unit breakdown (identical units grouped — click to expand)
| Units | Beds | Baths | Est. rent |
|---|---|---|---|
| 2× units | 3.0 | 2.5 | $3,544 |
| #1 | 3.0 | 2.5 | $1,772 |
| #2 | 3.0 | 2.5 | $1,772 |
| Total (2 units) | $3,544 | ||
UW: 25.0% down · 7.5% · 30yr · 1.5% tax · 5.0% vac · 8.0% maint · 8.0% mgmt
Financing live
Cash to close
- Down payment
- $114,975
- Closing costs
- $13,797
- Reserves months
- —
- Total cash needed
- —
Loan-product check · same deal, 3 products live
Conventional
25% down · 7.5% · 30yr
- Down + closing
- —
- Monthly P&I
- —
- Monthly cashflow
- —
- DSCR
- —
- Eligible?
- —
Personal DTI + credit; lowest rate.
DSCR
20% down · 8.5% · 30yr
- Down + closing
- —
- Monthly P&I
- —
- Monthly cashflow
- —
- DSCR
- —
- Eligible?
- —
No personal income docs; deal must DSCR.
Hard money
10% down · 12.0% · 12mo
- Down + closing
- —
- Monthly P&I
- —
- Monthly cashflow
- —
- DSCR
- —
- Eligible?
- —
Short-term bridge; refi at stabilization.
Listing history 12 events
-
2026-06-18days on market $459,900 Active 141 DOM
-
2026-06-17days on market $459,900 Active 140 DOM
-
2026-06-16days on market $459,900 Active 139 DOM
-
2026-06-15days on market $459,900 Active 138 DOM
-
2026-06-13days on market $459,900 Active 136 DOM
-
2026-06-10days on market $459,900 Active 132 DOM
-
2026-06-08days on market $459,900 Active 131 DOM
-
2026-06-07days on market $459,900 Active 130 DOM
-
2026-06-04days on market $459,900 Active 127 DOM
-
2026-06-01days on market $459,900 Active 124 DOM
-
2026-05-31days on market $459,900 Active 123 DOM
-
2026-01-28$459,900 Active 967-char remark
Show marketing remark (967 chars)
Experience the perfect blend of contemporary design and functional urban living with this stunning new construction 3 bedrooms and 2.5 bathrooms duplex coming soon! This architectural gem features two distinct units, each thoughtfully designed to span all three levels, providing a vertical living experience that maximizes privacy and space. The exterior boasts a sophisticated mix of modern finishes. Large, strategically placed windows throughout ensure each floor is bathed in natural light, creating an airy and inviting atmosphere from the ground up. Whether you are looking for a savvy investment property or a multi-generational living solution, these residences provide the flexibility and style demanded by the modern Houstonian. Located in a growing pocket of the city, this duplex represents a rare chance to own a piece of high-density, high-design real estate that doesn't compromise on curb appeal or structural integrity. Schedule your showing today!
ⓘ Source: listings_history table (triggers on properties + properties_extension) + one-shot
backfill from property_details.listing_events for pre-trigger history.
Nearby sold comps map
Loading sold comps map…
Walkable amenities ~0.75 mi
Loading nearby amenities…
Taxation est. · year 1
- Rental income
- $42,528
- − Mortgage interest
- −$25,762
- − Property taxes
- −$6,898
- − Insurance
- −$2,300
- − Repairs & maintenance
- −$3,402
- − Management
- −$3,402
- − Depreciation
- −$13,379
- Taxable loss
- −$12,615
- Est. tax savings @ 24.0%
- +$3,028
- After-tax cash flow
- $-1,514/yr
For passive investors: Depreciation is non-cash, so a rental often shows a tax loss while cash-flowing — sheltering income. Rental losses are passive: they offset passive income freely, and up to $25,000/yr can offset ordinary (W-2) income if you actively participate and your MAGI is under $100k (phasing out to $0 by $150k); unused losses carry forward. On sale, claimed depreciation is recaptured at up to 25%, and gains may owe capital-gains tax (a 1031 exchange can defer both). Figures are a year-1 estimate at your 24.0% rate — not tax advice; consult a CPA.
Schools (NCES district)
- District
- Houston ISD
- NCES district ID
- 4823640
- Math proficiency
- 27% ▼ -18.00%
- Reading proficiency
- 35% ▼ -6.00%
- Median HH income
- $46,054
- Composite
- 26.63/100
- National rank
- #7173
- State rank
- #593 of 826 in TX
Livability — Houston
- Score
- 74/100
- State rank
- #184
- US rank
- #4771
Category grades
Schools grade is shown separately in the Schools card above.
Census & demographics
- Census place
- Houston, TX
- County
- Harris County · 4,702,590 people
- City population
- 3,226,434
- Metro
- Houston-The Woodlands-Sugar Land, TX
- Population (ZIP)
- 19,109
- Household income
- $38,357
- Rent vs Own
- Severe rent burden
- 1177.0
Population outlook (Harris County) Hauer SSP2
- Today (2025)
- 5,571,493 people
- By 2030
- 6,089,821 · +9.3%
- By 2040
- 7,142,806 · +28.2%
- By 2050
- 8,185,864 · +46.9%
- By 2075
- 10,574,329 · +89.8%
- By 2100
- 12,109,958 · +117.4%
Race, ethnicity, and origin ACS 2023
- Neighborhood character
- Majority Black (57%)
- Race & ethnicity
- Black 57% Hispanic / Latino 41% Two or more races 15% White 2%
- Hispanic origin (detail)
- Mexican 36%
- Foreign-born
- 13% · Canada
- Languages at home
- 61% English-only · Spanish 38%
Political lean MEDSL · Harris
- 2024 margin
- Lean D (+5.5) · D 52.0% · R 46.4% · Other 1.6%
- 2008→2024 swing
- +3.9pp toward D · 2008: 1.6pp · 2024: 5.5pp
- All cycles
- 2024: D+5.5 2020: D+13.3 2016: D+12.4 2012: D+0.1 2008: D+1.6
Not yet ingested
- Civics
- —
Market trends
- HPI YoY
- ▲ 5.25%
- Current HPI
- 267.7798
- Rent YoY
- ▼ -1.55%
- Metro
- Houston-The Woodlands-Sugar Land, TX
- State GDP YoY
- ▲ 3.95%
- F500 in state
- 110
Industry mix (Fortune 500 HQ in TX)
| Industry | F500 HQs | Revenue |
|---|---|---|
| Energy | 16 | $1,198B |
|
||
| Technology | 5 | $198B |
|
||
| Engineering / Construction | 4 | $72B |
|
||
| Energy Services | 3 | $60B |
|
||
| Utilities | 3 | $41B |
|
||
| Healthcare | 2 | $330B |
|
||
Price history
1 event — show timeline
- 2026-01-28 Listed $459,900 HARMLS
Cash-flow waterfall
monthlySold comps — $/sqft
last 12 mo · ≤1 miLoading sold comps…