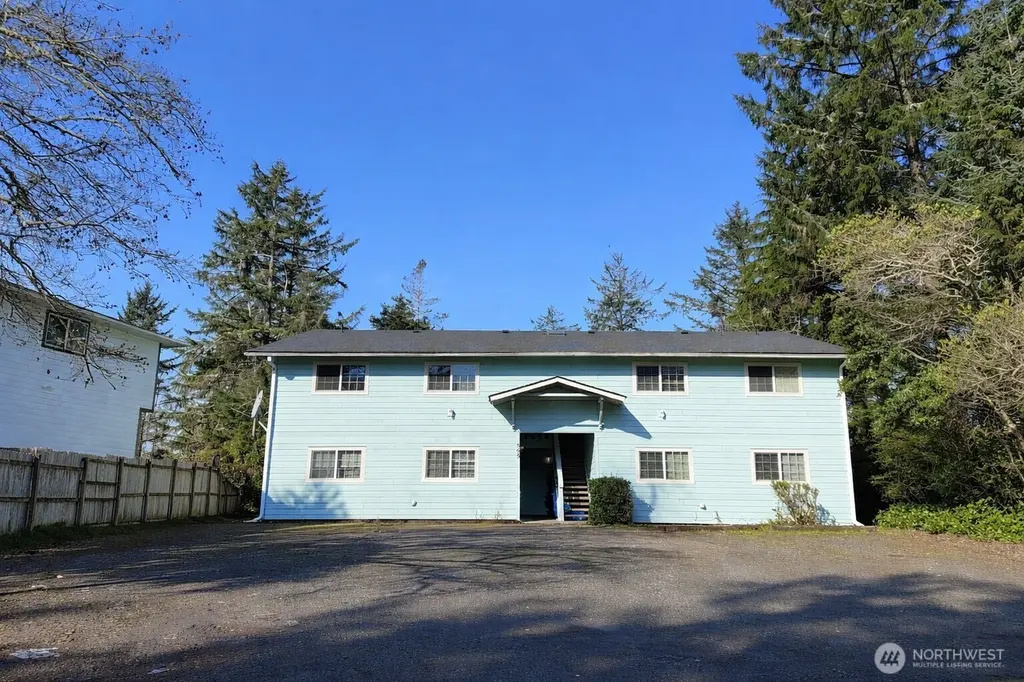
555 Sunset Ave NE
Ocean Shores, WA 98569
$578,000C
8 bd · 6.0 ba ·
3,952 sqft ·
Built 1974
· MultiFamily
· Active
· 80 DOM
Cashflow @ list (25.0% down · 7.5%)
Estimated rent
$6,035/mo
Mortgage (P&I)
−$3,031
Tax + insurance
−$505
HOA
−$0
Vac / Maint / Mgmt
−$1,267
Net cashflow
$1,232/mo
Annual
$14,782/yr
Cap rate
8.85%
Cash-on-cash
9.13%
DSCR
1.41
1% rule
1.04%
Cash to close
$161,840
Investor read
- This is a 4 × 2.0-bed/1.5-bath units multifamily listed at $578k.
- At list price, monthly cash flow is $1k ($15k/yr) — positive. Per door: $308/mo.
- The deal already cash-flows at list — no discount required.
- Meets the 1% rule at list price ($6k rent vs $578k).
- It's been on market 80 days — a 6% lower offer ($543k) is reasonable based on typical stale-listing flexibility.
- Recommended offer: $543k (6.0% below list) — sets the bar for market timing.
- Local home prices are declining (-3.0%/yr); year-one equity from $4k of loan paydown is wiped out by about $17k of value loss. Plan a longer hold.
- Location reads 62/100 on livability (#424 in WA) — a middle-class / working-renter tenant base. Strengths: housing A; Watch: schools C-, crime C-, health & safety C-.
- North Beach School District (rural): math 32% / reading 44% proficiency, ranked #236 of 291 in WA (top 81%) — families likely to look elsewhere, expect single-tenant / working-renter base with shorter leases; 63% free/reduced lunch — lower-income household profile, screen leases tightly.
- Market conditions: 653 active listings in the ZIP; 297 units permitted in Grays Harbor County in 2024 (17 in 5+ unit buildings).
- Grays Harbor County population projected at -24% by 2050 — secular population decline; favor cash flow + early exit over multi-decade hold.
- 6 sale attempts since 22y ago with the ask held roughly flat each time — persistent listings suggest the price (not the market) is what's stuck; bring a comps-based counter.
- Current owner paid $150k; list at $578k implies a 287% gain — meaningful room to come down on a strong offer.
- Cap rate 8.9% vs local median 3.1% in Ocean Shores — top-decile yield for the area; either an underpriced asset or a hidden risk that comps aren't pricing in. Stress-test before assuming the spread holds.
- At $6,035/mo this rent would consume 124% of the median local household income ($58k/yr) (locally 172% of renters already pay >50% of income on rent) — very limited rent-growth headroom before tenants either downsize or default.
Questions for listing agent
- It's been on market 80 days. Have you received any prior offers? Is the seller open to a 6% concession, seller financing, or rate buy-down credit?
- Can we see the unit-by-unit rent roll, current vacancy, and any below-market leases? What's the average tenancy length?
- What capital expenditures (roof, boiler, parking lot, exteriors) have been made in the last 5 years, and what's planned in the next 2?
- Built in 1974 — when were the roof, HVAC, electrical panel, plumbing, and water heater last replaced?
- Why hasn't it sold? Are there any deal-killer items the seller is aware of (foundation, flood, title, zoning, code violations)?
- Is there a deadline driving the sale (1031 exchange, divorce, estate, relocation)? That informs how much negotiation room exists.
- What's the average days-on-market for RENTAL listings here right now (not sales)? A rising rental-DOM trend means longer vacancies and softer asking-rent achievability than the comps imply.
- What's the recent tenant-quality profile in this submarket — average credit score on applications, eviction rate, late-payment / NSF rate, and stable-employment percentage? A property-management company in the area should have these aggregated.
CashFlowRE · CFR-7HSGXQDFHQSA83
· Data 1 day ago
cashflowre.app · 2026-05-29