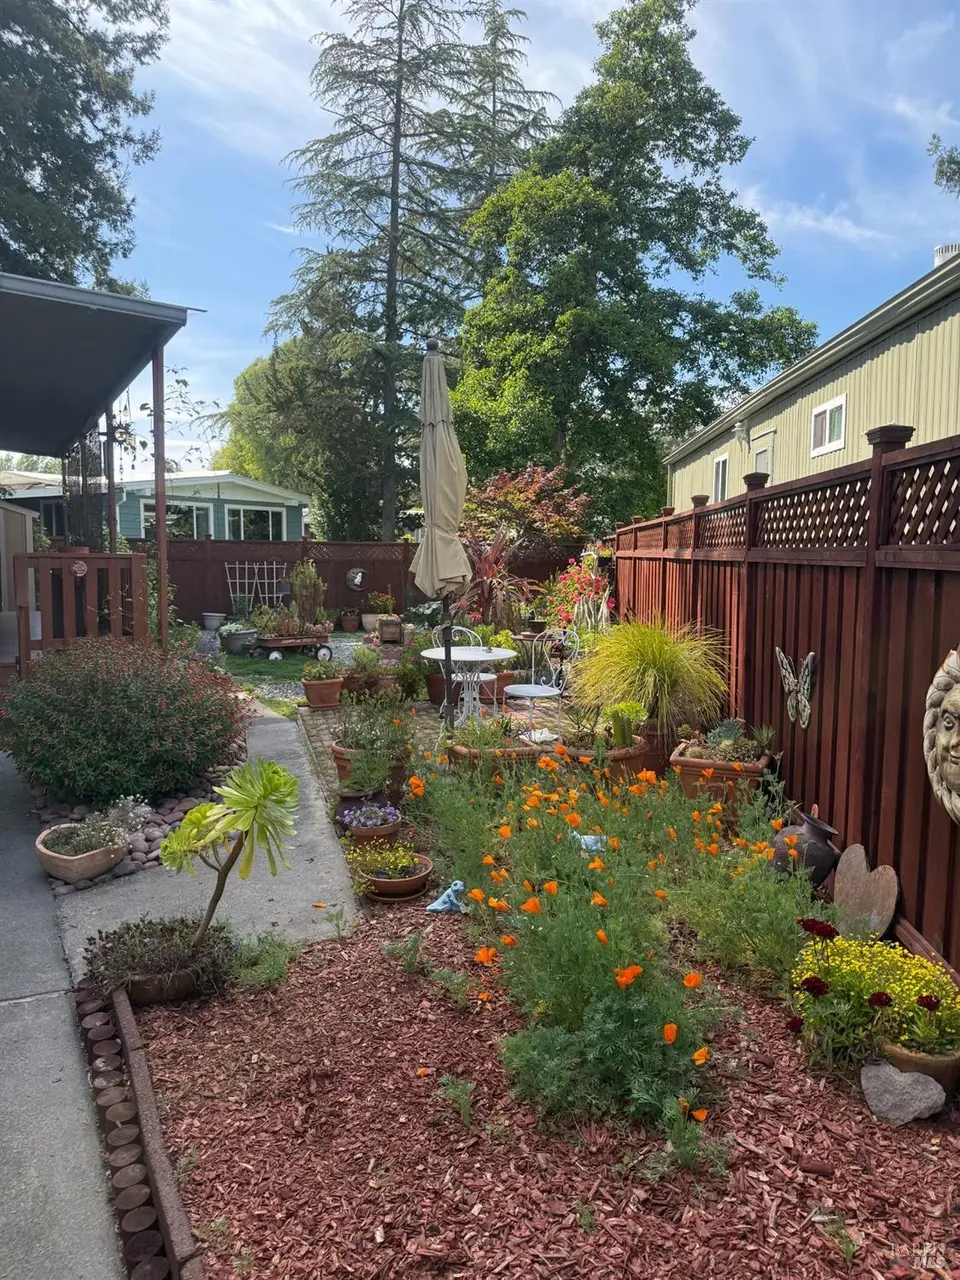
29 Hemlock Ct
Rohnert Park, CA 94928
$210,000B-
2 bd · 2.0 ba ·
1,440 sqft ·
Built 1971
· Manufactured
· Pending
· 34 DOM
Cashflow @ list (25.0% down · 7.5%)
Estimated rent
$2,718/mo
Mortgage (P&I)
−$1,101
Tax + insurance
−$416
HOA
−$0
Vac / Maint / Mgmt
−$571
Net cashflow
$630/mo
Annual
$7,557/yr
Cap rate
10.27%
Cash-on-cash
14.21%
DSCR
1.63
1% rule
1.29%
Cash to close
$58,800
Investor read
- This is a 2-bed/2.0-bath manufactured listed at $210k.
- At list price, monthly cash flow is $630 ($8k/yr) — positive.
- The deal already cash-flows at list — no discount required.
- Meets the 1% rule at list price ($3k rent vs $210k).
- It's been on market 34 days — a 3% lower offer ($204k) is reasonable based on typical stale-listing flexibility.
- Recommended offer: $204k (3.0% below list) — sets the bar for market timing.
- Local home prices are declining (-3.0%/yr); year-one equity from $1k of loan paydown is wiped out by about $6k of value loss. Plan a longer hold.
- Location reads 75/100 on livability (#116 in CA, #4,166 nationally) — a middle-class / working-renter tenant base. Strengths: commute A+, employment A+, health & safety A+; Watch: cost of living F.
- Cotati-Rohnert Park Unified (suburban): math 24% / reading 61% proficiency, ranked #205 of 517 in CA (top 40%) — families likely to look elsewhere, expect single-tenant / working-renter base with shorter leases.
- Watch-outs: flood insurance adds $66/mo.
- Market conditions: Rents rising (+2.7%/yr); 100 active listings in the ZIP; 31 comparable units currently listed for rent nearby; rentals at typical pace (median 22d on market — plan ~3-4 weeks tenant-placement turnaround); solid renter incomes; 1,039 units permitted in Sonoma County in 2024 (185 in 5+ unit buildings).
- Sonoma County population projected at +8% by 2050 — modest demand growth; plan on rents tracking national, not racing it.
- At projected returns (-3.0% appreciation + 2.7% rent growth), your $59k cash investment doubles in ~10 years — after that, you're playing with house money.
- Climate carrying-cost: major flood risk; moderate wildfire risk — expect insurance premiums to compound above CPI over the hold.
- Cap rate 10.3% vs local median 2.8% in Rohnert Park — top-decile yield for the area; either an underpriced asset or a hidden risk that comps aren't pricing in. Stress-test before assuming the spread holds.
- This rent runs 33% of the median local income ($99k/yr) — at the standard rent-burdened threshold; future hikes will face affordability resistance.
Questions for listing agent
- It's been on market 34 days. Have you received any prior offers? Is the seller open to a 3% concession, seller financing, or rate buy-down credit?
- Built in 1971 — when were the roof, HVAC, electrical panel, plumbing, and water heater last replaced?
- What's the actual annual flood-insurance premium (NFIP or private), and is the property in a SFHA with mandatory coverage?
- Is there a deadline driving the sale (1031 exchange, divorce, estate, relocation)? That informs how much negotiation room exists.
- Schools are B-rated — typically a magnet for longer-tenancy family renters. What's the average tenant stay here, and is there a school-zone premium baked into asking?
- What's the average days-on-market for RENTAL listings here right now (not sales)? A rising rental-DOM trend means longer vacancies and softer asking-rent achievability than the comps imply.
- What's the recent tenant-quality profile in this submarket — average credit score on applications, eviction rate, late-payment / NSF rate, and stable-employment percentage? A property-management company in the area should have these aggregated.
- How much new for-sale + rental construction is in the pipeline within 1–3 miles? Heavy new supply typically softens prices + rents 12–24 months out; constrained supply supports both.
CashFlowRE · CFR-7JHAVPD4WYSV7V
· Data 3 days ago
cashflowre.app · 2026-05-29