29 Hemlock Ct · Rohnert Park, CA
Flood risk 7/10 · Major
- FEMA flood zone
- X (unshaded)
- Chance of flooding over 30 yrs
- 0.99%
- Est. flood insurance / yr
- $507 – $1,088
Fire risk 5/10 · Moderate
- Est. fire insurance / yr
- $659 – $1,223
Heat risk 4/10 · Minor
- Hot days now (above 91°F)
- 7 days/yr
- Hot days in 30 yrs
- 15 days/yr
Wind risk 1/10 · Minimal
- Chance of severe wind over 30 yrs
- —
Air-quality risk 8/10 · Major
- Unhealthy air days now
- 14 days/yr
- Unhealthy air days in 30 yrs
- 15 days/yr
Risk factors via First Street. Map © Google.
Why this score? — see what drove the B- grade
The composite is a weighted blend of 9 inputs, each scored 0–100. Each bar is that input's sub-score; the figure is the points it added to the 100-point composite (weight × sub-score).
- Cash flow +28.7/30.0
- DSCR +10.0/10.0
- ARV discount +8.6/15.0
- 1% rule +7.9/10.0
- Livability +3.8/5.0
- Schools +3.7/10.0
- Rent growth +3.2/5.0
- Condition / age +2.5/5.0
- Appreciation +0.0/10.0
$210,000
🖨 Deal sheet 📄 Offer letter ✓ Due diligence
Listing remarks
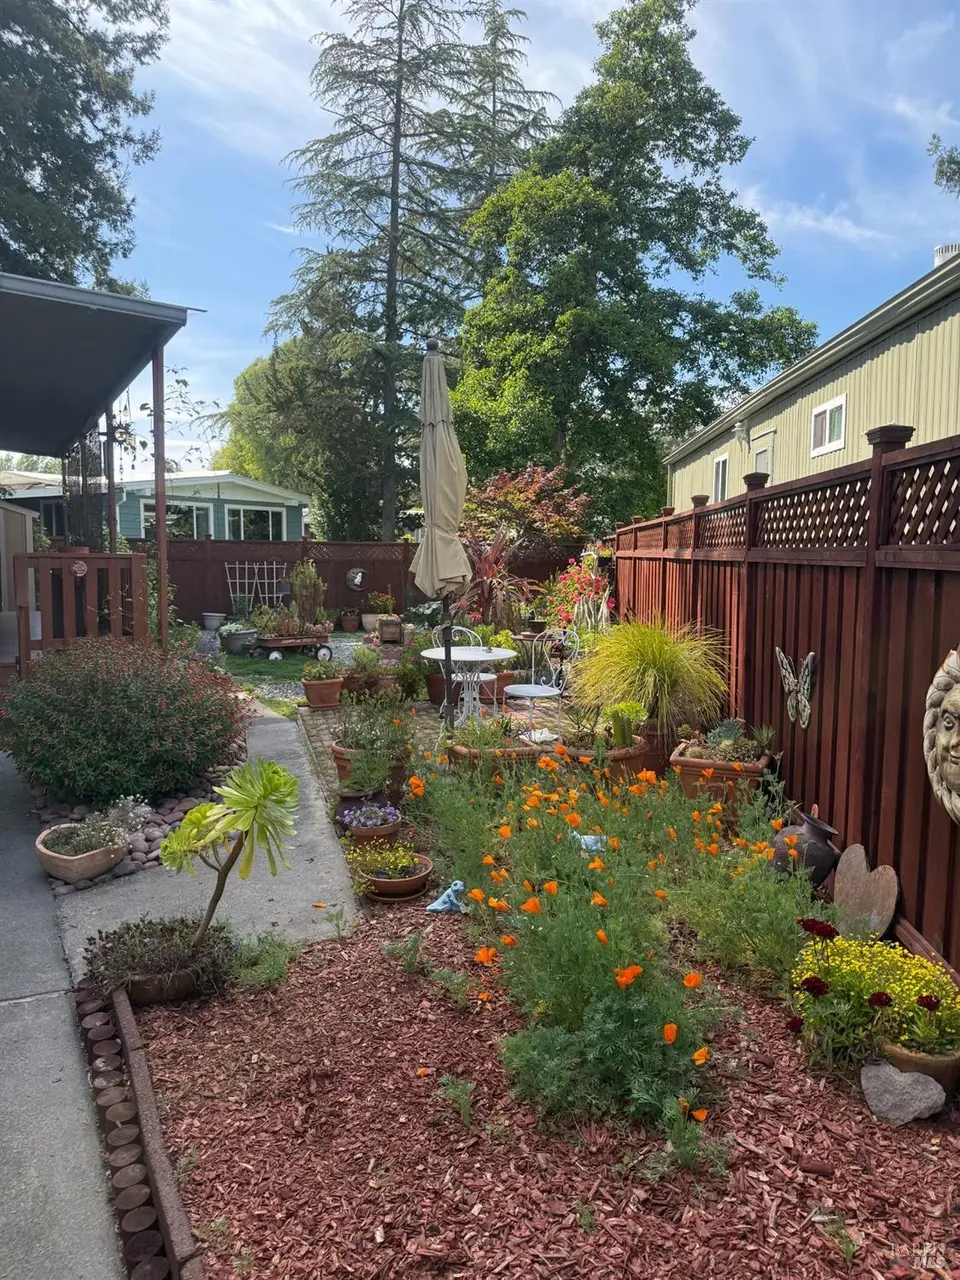
Charming and beautifully maintained older manufactured home offering 2 bedrooms, 2 baths, and 1,440 square feet of comfortable living space on a spacious lot. Full of warmth and pride of ownership, this inviting home features numerous thoughtful updates including upgraded dual-pane windows, recently added durable vinyl laminate flooring & bedroom carpeting, a recently recoated roof for added peace of mind. The spacious lot provides plenty of room to relax, garden, or entertain, while the redwood fence and expansive wood patio deck have both been recently re-stained, adding fresh curb appeal and outdoor charm. A convenient Tuff Shed offers extra storage, and the functional, well-kept f
Key facts
- Redwood fence
- Convenient tuff shed
- New water heater
Tags
Property features AI
Finance
- Financial info: Land lease amount: $870
- HOA & community: No HOA; Senior community
Exterior
- Parking: Covered side-by-side parking for 2 vehicles
- Utilities: Underground utilities; Public sewer
- Home design: Manufactured in park (double wide); Land lease community
- Construction: Foam roof; Metal roof; Aluminum skirting; Sherwood double wide manufactured home
- Exterior features: Covered deck; Carport awning; Porch awning; Fenced yard; Front yard; Close to clubhouse; Located on a cul-de-sac; Shed(s)
Interior
- Bedrooms: 2 bedrooms
- Bathrooms: 2 full bathrooms; Shower stall(s); Tub with shower over
- Heating & cooling: Heating: see remarks; Cooling: see remarks
- Interior features: Carbon monoxide detector; Smoke detector
- Laundry & utility: Laundry room inside
Neighborhood map
What this means for you Summary
Snapshot
- This is a 2-bed/2.0-bath manufactured listed at $210k.
Deal economics
- At list price, monthly cash flow is $630 ($8k/yr) — positive.
- The deal already cash-flows at list — no discount required.
- Meets the 1% rule at list price ($3k rent vs $210k).
- Recommended offer: $204k (3.0% below list) — sets the bar for market timing.
- Cap rate 10.3% vs local median 2.8% in Rohnert Park — top-decile yield for the area; either an underpriced asset or a hidden risk that comps aren't pricing in. Stress-test before assuming the spread holds.
Location & tenants
- Location reads 75/100 on livability (#116 in CA, #4,166 nationally) — a middle-class / working-renter tenant base. Strengths: commute A+, employment A+, health & safety A+; Watch: cost of living F.
- Cotati-Rohnert Park Unified (suburban): math 24% / reading 61% proficiency, ranked #205 of 517 in CA (top 40%) — families likely to look elsewhere, expect single-tenant / working-renter base with shorter leases.
- Market conditions: Rents rising (+2.7%/yr); 100 active listings in the ZIP; 31 comparable units currently listed for rent nearby; rentals at typical pace (median 21d on market — plan ~3-4 weeks tenant-placement turnaround); solid renter incomes; 1,039 units permitted in Sonoma County in 2024 (185 in 5+ unit buildings).
- This rent runs 33% of the median local income ($99k/yr) — at the standard rent-burdened threshold; future hikes will face affordability resistance.
Forward outlook
- Local home prices are declining (-3.0%/yr); year-one equity from $1k of loan paydown is wiped out by about $6k of value loss. Plan a longer hold.
- Sonoma County population projected at +8% by 2050 — modest demand growth; plan on rents tracking national, not racing it.
- At projected returns (-3.0% appreciation + 2.7% rent growth), your $59k cash investment doubles in ~10 years — after that, you're playing with house money.
Negotiation context
- It's been on market 34 days — a 3% lower offer ($204k) is reasonable based on typical stale-listing flexibility.
Risks & watch-outs
- Watch-outs: flood insurance adds $66/mo.
- Climate carrying-cost: major flood risk; moderate wildfire risk — expect insurance premiums to compound above CPI over the hold.
Questions for the listing agent
- It's been on market 34 days. Have you received any prior offers? Is the seller open to a 3% concession, seller financing, or rate buy-down credit?
- Built in 1971 — when were the roof, HVAC, electrical panel, plumbing, and water heater last replaced?
- What's the actual annual flood-insurance premium (NFIP or private), and is the property in a SFHA with mandatory coverage?
- Is there a deadline driving the sale (1031 exchange, divorce, estate, relocation)? That informs how much negotiation room exists.
- Schools are B-rated — typically a magnet for longer-tenancy family renters. What's the average tenant stay here, and is there a school-zone premium baked into asking?
- What's the average days-on-market for RENTAL listings here right now (not sales)? A rising rental-DOM trend means longer vacancies and softer asking-rent achievability than the comps imply.
- What's the recent tenant-quality profile in this submarket — average credit score on applications, eviction rate, late-payment / NSF rate, and stable-employment percentage? A property-management company in the area should have these aggregated.
- How much new for-sale + rental construction is in the pipeline within 1–3 miles? Heavy new supply typically softens prices + rents 12–24 months out; constrained supply supports both.
Investment metrics
- 1% rule
- 1.29% ✓
- Cap rate
- 10.27%
- Cash-on-cash
- 14.21%
- DSCR
- 1.63
- GRM
- 6.4
CMA / ARV
- ARV (median comp)
- $215,268
- List price
- $210,000
- Delta
- -2.45%
- Verdict
- FAIR
- Comps
- 18 within 1.0 mi
Show comp detail 12 sales within ~0.75 mi
| Address | Dist | Beds/Ba | Sqft | Sold | Price | $/sf | Match |
|---|---|---|---|---|---|---|---|
| 57 Mulberry Ct | 0.03mi | 2/2.0 | 1,375 (-4%) | 8mo | $215,000 | $156 | 84 |
| 232 Walnut Cir | 0.11mi | 2/2.0 | 1,440 (0%) | 13mo | $250,000 | $174 | 84 |
| 64 Acacia Ct | 0.06mi | 3/2.0 (+1) | 1,344 (-7%) | 0mo | $250,000 | $186 | 81 |
| 175 Walnut Cir | 0.14mi | 3/2.0 (+1) | 1,440 (0%) | 10mo | $302,000 | $210 | 80 |
| 138 Walnut Cir | 0.06mi | 2/2.0 | 1,318 (-8%) | 7mo | $262,000 | $199 | 77 |
| 67 Acacia Ct | 0.07mi | 2/2.0 | 1,344 (-7%) | 12mo | $207,500 | $154 | 76 |
| 123 Walnut Cir | 0.10mi | 2/2.0 | 1,536 (+7%) | 13mo | $189,000 | $123 | 74 |
| 25 Walnut Cir | 0.08mi | 3/2.0 (+1) | 1,549 (+8%) | 12mo | $310,000 | $200 | 69 |
| 318 Rustic Ln | 0.08mi | 2/2.0 | 1,248 (-13%) | 9mo | $316,000 | $253 | 66 |
| 281 Circulo San Lucas | 0.66mi | 2/2.0 | 1,440 (0%) | 9mo | $181,000 | $126 | 62 |
| 226 Parque Margarita Ct | 0.74mi | 2/2.0 | 1,344 (-7%) | 12mo | $213,000 | $158 | 44 |
| 297 Circle Puebla | 0.64mi | 2/2.0 | 1,248 (-13%) | 11mo | $205,000 | $164 | 39 |
Match score weights: distance 35% · size 25% · config 20% · recency 20%. Top-matched comps best support the ARV.
Projected returns pro-forma
-3.0% appreciation · 2.69% rent growth · sell at horizon
- IRR
- 2.4%
- Equity multiple
- 1.09×
- Total profit
- $5,316
- Equity at exit
- $31,312
- IRR
- 11.7%
- Equity multiple
- 1.90×
- Total profit
- $53,160
- Equity at exit
- $18,157
Cash invested: $58,800 (down + closing). Projections, not guarantees.
Landlord ↔ Tenant lean methodology
- Overall (STATE)
- 18 Strongly Tenant-Friendly
- State California
- 18 Strongly Tenant-Friendly · D+13
- County
- — inherits STATE
- City
- — inherits STATE
ZIP-level market 94928
- Rents YoY
- 2.7%
- Active inventory
- 100
- Price-to-rent
- 6.4×
Monthly cashflow live
- Estimated rent
- $2,718 high interval (Pro) →
- Mortgage (P&I)
- −$1,101
- Tax est. 1.5%
- −$262 /mo · $3,150/yr
- Insurance
- −$88
- Flood insurance flood zone
- −$66 /mo · $798/yr
- HOA
- −$0
- Vacancy / Maint / Mgmt
- −$571
- Net cashflow
- $630
Break-even live
UW: 25.0% down · 7.5% · 30yr · 1.5% tax · 5.0% vac · 8.0% maint · 8.0% mgmt
Financing live
Cash to close
- Down payment
- $52,500
- Closing costs
- $6,300
- Reserves months
- —
- Total cash needed
- —
Loan-product check · same deal, 3 products live
Conventional
25% down · 7.5% · 30yr
- Down + closing
- —
- Monthly P&I
- —
- Monthly cashflow
- —
- DSCR
- —
- Eligible?
- —
Personal DTI + credit; lowest rate.
DSCR
20% down · 8.5% · 30yr
- Down + closing
- —
- Monthly P&I
- —
- Monthly cashflow
- —
- DSCR
- —
- Eligible?
- —
No personal income docs; deal must DSCR.
Hard money
10% down · 12.0% · 12mo
- Down + closing
- —
- Monthly P&I
- —
- Monthly cashflow
- —
- DSCR
- —
- Eligible?
- —
Short-term bridge; refi at stabilization.
Rent comps 31 comps
| Address | Beds | Baths | Sqft | Rent | $/sqft | DOM | Units | Dist |
|---|---|---|---|---|---|---|---|---|
| 687 Racquet Club Cir Rohnert Park, CA | 2.0 | 1.5 | 1162 | $2,550 | $2.19 | 44d | 1 | 0.26mi |
| 658 Racquet Club Cir Rohnert Park, CA | 2.0 | 1.5 | 1162 | $2,995 | $2.58 | 14d | 1 | 0.32mi |
| 423 Enterprise Dr #423 Rohnert Park, CA | 3.0 | 1.5 | 1246 | $3,150 | $2.53 | 23d | 1 | 0.37mi |
| 465 Enterprise Dr Rohnert Park, CA | 3.0 | 2.0 | 1260 | $2,750 | $2.18 | 23d | 1 | 0.37mi |
| 338 City Center Dr Rohnert Park, CA | 2.0 | 2.5 | 1229 | $3,000 | $2.44 | 21d | 1 | 0.58mi |
| 5425 Snyder Ln Rohnert Park, CA | 2.0 | 2.0 | 960 | $2,400 | $2.50 | 13d | 1 | 0.69mi |
| 445 Southwest Blvd Unit 10 Rohnert Park, CA | 3.0 | 2.0 | 1250 | $2,699 | $2.16 | 43d | 1 | 0.70mi |
| 7101 Avenida Cala Unit 02 Rohnert Park, CA | 3.0 | 2.0 | 1250 | $2,850 | $2.28 | 23d | 1 | 0.70mi |
| 7300 Boris Ct Apt 17 Rohnert Park, CA | 2.0 | 1.0 | 1000 | $2,250 | $2.25 | 21d | 1 | 0.73mi |
| 7300 Boris Ct Unit 4 Rohnert Park, CA | 2.0 | 1.0 | 1000 | $2,350 | $2.35 | 23d | 1 | 0.73mi |
| 7300 Boris Ct Apt 17 Rohnert Park, CA | 2.0 | 1.0 | 1000 | $2,350 | $2.35 | 43d | 1 | 0.73mi |
| 7300 Boris Ct Apt 17 Rohnert Park, CA | 2.0 | 1.0 | 1000 | $2,250 | $2.25 | 23d | 1 | 0.73mi |
| 7300 Boris Ct Unit 4 Rohnert Park, CA | 2.0 | 1.0 | 1000 | $2,250 | $2.25 | 43d | 1 | 0.73mi |
| 100 Avram Ave Rohnert Park, CA | 3.0 | 1.0–2.0 | 1267 | $2,900 | $2.29 | 3d | 1 | 0.73mi |
| 1440 Southwest Blvd Rohnert Park, CA | 2.0 | 1.5–2.0 | 890 | $2,249 | $2.53 | 13d | 3 | 0.74mi |
| 1440 Southwest Blvd Apt 27 Rohnert Park, CA | 2.0 | 2.0 | 950 | $2,099 | $2.21 | 43d | 1 | 0.74mi |
| 1440 Southwest Blvd Unit 18 Rohnert Park, CA | 2.0 | 2.0 | 950 | $2,299 | $2.42 | 14d | 1 | 0.74mi |
| 1358 Parkway Dr Rohnert Park, CA | 2.0 | 2.0 | 1104 | $2,600 | $2.36 | 14d | 1 | 0.78mi |
| 1350 Oak View Cir Rohnert Park, CA | 2.0 | 1.0–2.0 | 750 | $3,310 | $4.41 | 13d | 8 | 0.81mi |
| 7272 Camino Colegio Rohnert Park, CA | 1.0–2.0 | 1.0–2.0 | 839 | $2,500 | $2.98 | 13d | 1 | 0.92mi |
| 4949 Snyder Ln Rohnert Park, CA | 1.0–2.0 | 1.0–2.0 | 779 | $2,621 | $3.36 | 13d | 11 | 0.93mi |
| 8244 Windmill Farms Dr Unit 1 Cotati, CA | 2.0 | 1.5 | 989 | $2,400 | $2.43 | 43d | 1 | 1.09mi |
| 8271 Lancaster Dr Cotati, CA | 3.0 | 3.5 | 1614 | $3,500 | $2.17 | 21d | 1 | 1.15mi |
| 5401 Kaitlyn Pl Rohnert Park, CA | 3.0 | 2.5 | 1838 | $5,000 | $2.72 | 14d | 1 | 1.23mi |
| 7 Meridian Cir Rohnert Park, CA | 3.0 | 2.5 | 1289 | $3,275 | $2.54 | 43d | 1 | 1.26mi |
| 541 Carlson Ave Rohnert Park, CA | 1.0–3.0 | 1.0–2.0 | 1065 | $3,278 | $3.08 | 2d | 6 | 1.31mi |
| 1388 Miramonte Pl Rohnert Park, CA | 3.0 | 2.0 | 1442 | $3,800 | $2.64 | 43d | 1 | 1.32mi |
| 5102 Dowdell Ave Rohnert Park, CA | 1.0–2.0 | 1.0–2.0 | 949 | $3,279 | $3.46 | 13d | 14 | 1.34mi |
| 1 Golf Course Dr Rohnert Park, CA | 3.0 | 2.0 | 1485 | $950 | $0.64 | 43d | 1 | 1.43mi |
| 600 Rohnert Park Expy W Rohnert Park, CA | 1.0–3.0 | 1.0–2.0 | 1122 | $2,903 | $2.59 | 1d | 18 | 1.44mi |
| 8201 Camino Colegio #1 Rohnert Park, CA | 2.0 | 2.0 | 878 | $2,350 | $2.68 | 23d | 1 | 1.46mi |
Listing history 17 events
-
2026-06-17status $210,000 Pending 34 DOM
-
2026-06-17days on market $210,000 Contingent (Show) 34 DOM
-
2026-06-16days on market $210,000 Contingent (Show) 33 DOM
-
2026-06-15days on market $210,000 Contingent (Show) 32 DOM
-
2026-06-14days on market $210,000 Contingent (Show) 30 DOM
-
2026-06-13days on market $210,000 Contingent (Show) 29 DOM
-
2026-06-10days on market $210,000 Contingent (Show) 27 DOM
-
2026-06-09days on market $210,000 Contingent (Show) 26 DOM
-
2026-06-08days on market $210,000 Contingent (Show) 25 DOM
-
2026-06-07days on market $210,000 Contingent (Show) 24 DOM
-
2026-06-05days on market $210,000 Contingent (Show) 21 DOM
-
2026-06-03days on market $210,000 Contingent (Show) 20 DOM
-
2026-06-02days on market $210,000 Contingent (Show) 19 DOM
-
2026-06-01days on market $210,000 Contingent (Show) 18 DOM
-
2026-05-31statusdays on market $210,000 Contingent (Show) 17 DOM
-
2026-05-30days on market $210,000 Active 16 DOM
-
2026-05-14$210,000 Active 878-char remark
ⓘ Source: listings_history table (triggers on properties + properties_extension) + one-shot
backfill from property_details.listing_events for pre-trigger history.
Climate risk First Street
- Flood 7/10 Severe FEMA zone X (unshaded) · 99% chance over 30 yrs
- Wildfire 5/10 Major
- Heat 4/10 Moderate 7 d/yr ≥91°F today · 15 d/yr by 30 yrs out
- Wind 1/10 Low
- Air quality 8/10 Severe 14 unhealthy d/yr today · 15 by 30 yrs out
Nearby sold comps map
Loading sold comps map…
Walkable amenities ~0.75 mi
Loading nearby amenities…
Taxation est. · year 1
- Rental income
- $32,620
- − Mortgage interest
- −$11,763
- − Property taxes
- −$3,150
- − Insurance
- −$1,847
- − Repairs & maintenance
- −$2,610
- − Management
- −$2,610
- − Depreciation
- −$6,109
- Taxable income
- $4,531
- Est. tax owed @ 24.0%
- −$1,087
- After-tax cash flow
- $6,469/yr
For passive investors: Depreciation is non-cash, so a rental often shows a tax loss while cash-flowing — sheltering income. Rental losses are passive: they offset passive income freely, and up to $25,000/yr can offset ordinary (W-2) income if you actively participate and your MAGI is under $100k (phasing out to $0 by $150k); unused losses carry forward. On sale, claimed depreciation is recaptured at up to 25%, and gains may owe capital-gains tax (a 1031 exchange can defer both). Figures are a year-1 estimate at your 24.0% rate — not tax advice; consult a CPA.
Schools (NCES district)
- District
- Cotati-Rohnert Park Unified
- NCES district ID
- 0609940
- Math proficiency
- 24% ▼ -6.00%
- Reading proficiency
- 61% ▲ 15.00%
- Median HH income
- $60,499
- Composite
- 37.42/100
- National rank
- #4420
- State rank
- #205 of 517 in CA
Livability — Rohnert Park
- Score
- 75/100
- State rank
- #116
- US rank
- #4166
Category grades
Schools grade is shown separately in the Schools card above.
Census & demographics
- Census place
- Rohnert Park, CA
- County
- Sonoma County · 449,805 people
- City population
- 46,829
- Metro
- Santa Rosa-Petaluma, CA
- Population (ZIP)
- 46,829
- Household income
- $99,280
- Rent vs Own
- Severe rent burden
- 2507.0
Population outlook (Sonoma County) Hauer SSP2
- Today (2025)
- 539,935 people
- By 2030
- 554,870 · +2.8%
- By 2040
- 573,262 · +6.2%
- By 2050
- 580,715 · +7.6%
- By 2075
- 579,229 · +7.3%
- By 2100
- 547,835 · +1.5%
Race, ethnicity, and origin ACS 2023
- Neighborhood character
- Diverse neighborhood (Simpson 0.62)
- Race & ethnicity
- White 52% Hispanic / Latino 33% Two or more races 19% Asian 6% Black 3% Native American 1%
- Hispanic origin (detail)
- Mexican 25%
- Common ancestry
- Italian 5% Slovak 3% Romanian 2%
- Foreign-born
- 15% · Canada, China, Vietnam
- Languages at home
- 72% English-only · Spanish 20% Other Asian/Pacific 2% Russian/Polish/Slavic 1%
Political lean MEDSL · Sonoma
- 2024 margin
- Solid D (+46.2) · D 71.4% · R 25.2% · Other 3.3%
- 2008→2024 swing
- -3.4pp toward R · 2008: 49.6pp · 2024: 46.2pp
- All cycles
- 2024: D+46.2 2020: D+51.5 2016: D+47.9 2012: D+44.9 2008: D+49.6
Not yet ingested
- Civics
- —
Market trends
- HPI YoY
- ▼ -628.14%
- Current HPI
- 259.9121
- Rent YoY
- ▲ 2.69%
- Metro
- Santa Rosa-Petaluma, CA
- State GDP YoY
- ▲ 3.21%
- F500 in state
- 116
Industry mix (Fortune 500 HQ in CA)
| Industry | F500 HQs | Revenue |
|---|---|---|
| Technology | 27 | $1,492B |
|
||
| Financial Services | 3 | $174B |
|
||
| Retail | 3 | $44B |
|
||
| Insurance | 3 | $26B |
|
||
| Media / Entertainment | 2 | $115B |
|
||
| Pharmaceuticals / Biotech | 2 | $62B |
|
||
Price history
3 events — show timeline
- 2026-06-17 Pending — BAREIS
- 2026-05-31 Contingent — BAREIS
- 2026-05-14 Listed $210,000 BAREIS
Property tax history
-5.1%/yrLatest (2025): $143 · +0.5% YoY. Source: county tax records.
Cash-flow waterfall
monthlySold comps — $/sqft
last 12 mo · ≤1 miLoading sold comps…