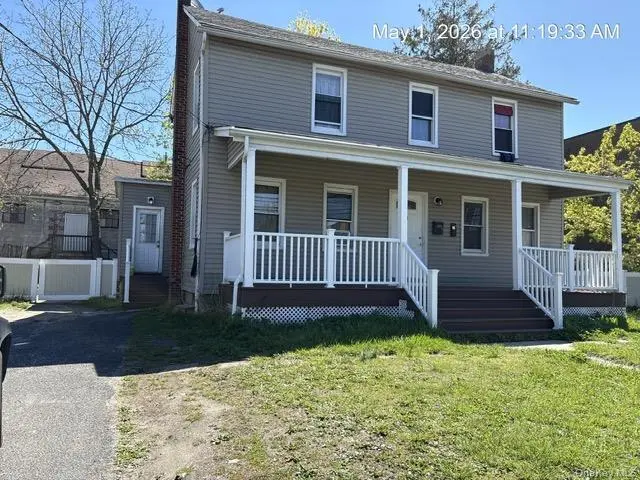
11 Bay Ave
East Patchogue, NY 11772
$730,000B-
5 bd · 3.0 ba ·
1,854 sqft ·
Built 1900
· MultiFamily
· Active
· 29 DOM
Cashflow @ list (25.0% down · 7.5%)
Estimated rent
$7,874/mo
Mortgage (P&I)
−$3,828
Tax + insurance
−$852
HOA
−$0
Vac / Maint / Mgmt
−$1,654
Net cashflow
$1,540/mo
Annual
$18,484/yr
Cap rate
8.82%
Cash-on-cash
9.04%
DSCR
1.40
1% rule
1.08%
Cash to close
$204,400
Investor read
- This is a 5-bed/3.0-bath multifamily listed at $730k.
- At list price, monthly cash flow is $2k ($18k/yr) — positive.
- The deal already cash-flows at list — no discount required.
- Meets the 1% rule at list price ($8k rent vs $730k).
- It's been on market 29 days — a 2% lower offer ($719k) is reasonable based on typical stale-listing flexibility.
- Recommended offer: $719k (1.5% below list) — sets the bar for market timing.
- Local home prices are declining (-3.0%/yr); year-one equity from $5k of loan paydown is wiped out by about $22k of value loss. Plan a longer hold.
- Location reads 64/100 on livability (#769 in NY) — a middle-class / working-renter tenant base. Strengths: employment A+, housing A+, health & safety B; Watch: schools D, amenities F, commute F.
- Patchogue-Medford Union Free School District (suburban): math 83% / reading 69% proficiency, ranked #73 of 590 in NY (top 12%) — strong family-tenant draw, lease renewals of 3-5y typical.
- Watch-outs: built in 1900 — expect roof / HVAC / electrical / plumbing capex.
- Market conditions: Rents rising fast (+5.1%/yr); 216 active listings in the ZIP; solid renter incomes; 1,366 units permitted in Suffolk County in 2024 (216 in 5+ unit buildings).
- Suffolk County population projected to shrink 5% by 2050 — rents likely to lag national; underwrite the cash flow, not the appreciation.
- Current owner paid $339k; list at $730k implies a 115% gain — meaningful room to come down on a strong offer.
- At projected returns (-3.0% appreciation + 5.1% rent growth), your $204k cash investment doubles in ~10 years — after that, you're playing with house money.
- Cap rate 8.8% vs local median 3.1% in East Patchogue — top-decile yield for the area; either an underpriced asset or a hidden risk that comps aren't pricing in. Stress-test before assuming the spread holds.
- At $7,874/mo this rent would consume 90% of the median local household income ($105k/yr) (locally 1595% of renters already pay >50% of income on rent) — very limited rent-growth headroom before tenants either downsize or default.
Questions for listing agent
- Built in 1900 — when were the roof, HVAC, electrical panel, plumbing, and water heater last replaced?
- Is there a deadline driving the sale (1031 exchange, divorce, estate, relocation)? That informs how much negotiation room exists.
- Schools are D-rated, which usually means shorter tenancies and higher turnover. Who's the typical renter profile here, and what's been the actual vacancy rate?
- What's the average days-on-market for RENTAL listings here right now (not sales)? A rising rental-DOM trend means longer vacancies and softer asking-rent achievability than the comps imply.
- What's the recent tenant-quality profile in this submarket — average credit score on applications, eviction rate, late-payment / NSF rate, and stable-employment percentage? A property-management company in the area should have these aggregated.
- How much new apartment / multifamily construction is in the pipeline within 1–3 miles? Heavy new supply (>2% of stock underway) typically softens rents 12–24 months out; light construction supports rent growth.
CashFlowRE · CFR-7K83AS9BGNP05F
· Data 2 weeks ago
cashflowre.app · 2026-05-29