 Multi-family
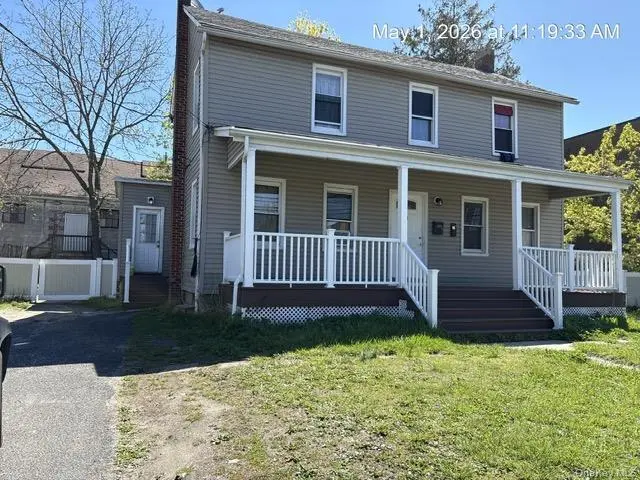
11 Bay Ave · East Patchogue, NY
Flood risk No data
- FEMA flood zone
- —
- Chance of flooding over 30 yrs
- —
- Est. flood insurance / yr
- —
Fire risk No data
- Est. fire insurance / yr
- —
Heat risk No data
- Hot days now (above threshold)
- —
- Hot days in 30 yrs
- —
Wind risk No data
- Chance of severe wind over 30 yrs
- —
Air-quality risk No data
- Unhealthy air days now
- —
- Unhealthy air days in 30 yrs
- —
Risk factors via First Street. Map © Google.
Why this score? — see what drove the B- grade
The composite is a weighted blend of 9 inputs, each scored 0–100. Each bar is that input's sub-score; the figure is the points it added to the 100-point composite (weight × sub-score).
- Cash flow +24.8/30.0
- ARV discount +15.0/15.0
- DSCR +8.0/10.0
- Schools +6.7/10.0
- 1% rule +5.8/10.0
- Rent growth +3.8/5.0
- Livability +3.2/5.0
- Condition / age +2.5/5.0
- Appreciation +0.0/10.0
$730,000
🖨 Deal sheet 📄 Offer letter ✓ Due diligence
Multi-family units
County records classify this as Multi-Family (2-4 Unit). Listing-text estimate: 1 unit. estimate disagrees with records
Listing remarks
Updated Legal 2 Family with separate oil burners, oil tanks and electric meters. Non-Owner Occupied. Tenants want to stay. Low taxes. Convenient to restaurants, theatre and train. Tenants pay utilities. All permits are current. Great investment.
Key facts
- Separate oil burners
- Electric meters
- Oil tanks
Tags
Property features AI
Exterior
- Parking: Driveway; No carport
- Utilities: Cesspool sewer; Cable available; Electricity connected; Private trash collection; Water available and connected
- Home design: Single family residence; Two levels
- Construction: Frame construction
- Exterior features: Frame construction; Near public transit; Near shops; Paved access
Interior
- Kitchen: Electric oven; Electric range; Microwave; Refrigerator; Exhaust fan
- Bedrooms: Bedrooms on two levels
- Bathrooms: Three full bathrooms
- Heating & cooling: Baseboard heating; Hot water heating; Oil heating; No central cooling
- Interior features: Eat-in kitchen; Pantry; Nine total rooms
- Laundry & utility: Electric water heater
Neighborhood map
What this means for you Summary
Snapshot
- This is a 5-bed/3.0-bath multifamily listed at $730k.
Deal economics
- At list price, monthly cash flow is $2k ($18k/yr) — positive.
- The deal already cash-flows at list — no discount required.
- Meets the 1% rule at list price ($8k rent vs $730k).
- Recommended offer: $719k (1.5% below list) — sets the bar for market timing.
- Cap rate 8.8% vs local median 3.1% in East Patchogue — top-decile yield for the area; either an underpriced asset or a hidden risk that comps aren't pricing in. Stress-test before assuming the spread holds.
Location & tenants
- Location reads 64/100 on livability (#769 in NY) — a middle-class / working-renter tenant base. Strengths: employment A+, housing A+, health & safety B; Watch: schools D, amenities F, commute F.
- Patchogue-Medford Union Free School District (suburban): math 83% / reading 69% proficiency, ranked #73 of 590 in NY (top 12%) — strong family-tenant draw, lease renewals of 3-5y typical.
- Market conditions: Rents rising fast (+5.1%/yr); 216 active listings in the ZIP; solid renter incomes; 1,366 units permitted in Suffolk County in 2024 (216 in 5+ unit buildings).
- At $7,874/mo this rent would consume 90% of the median local household income ($105k/yr) (locally 1595% of renters already pay >50% of income on rent) — very limited rent-growth headroom before tenants either downsize or default.
Forward outlook
- Local home prices are declining (-3.0%/yr); year-one equity from $5k of loan paydown is wiped out by about $22k of value loss. Plan a longer hold.
- Suffolk County population projected to shrink 5% by 2050 — rents likely to lag national; underwrite the cash flow, not the appreciation.
- At projected returns (-3.0% appreciation + 5.1% rent growth), your $204k cash investment doubles in ~10 years — after that, you're playing with house money.
Negotiation context
- It's been on market 29 days — a 2% lower offer ($719k) is reasonable based on typical stale-listing flexibility.
- Current owner paid $339k; list at $730k implies a 115% gain — meaningful room to come down on a strong offer.
Risks & watch-outs
- Watch-outs: built in 1900 — expect roof / HVAC / electrical / plumbing capex.
Questions for the listing agent
- Built in 1900 — when were the roof, HVAC, electrical panel, plumbing, and water heater last replaced?
- Is there a deadline driving the sale (1031 exchange, divorce, estate, relocation)? That informs how much negotiation room exists.
- Schools are D-rated, which usually means shorter tenancies and higher turnover. Who's the typical renter profile here, and what's been the actual vacancy rate?
- What's the average days-on-market for RENTAL listings here right now (not sales)? A rising rental-DOM trend means longer vacancies and softer asking-rent achievability than the comps imply.
- What's the recent tenant-quality profile in this submarket — average credit score on applications, eviction rate, late-payment / NSF rate, and stable-employment percentage? A property-management company in the area should have these aggregated.
- How much new apartment / multifamily construction is in the pipeline within 1–3 miles? Heavy new supply (>2% of stock underway) typically softens rents 12–24 months out; light construction supports rent growth.
Investment metrics
- 1% rule
- 1.08% ✓
- Cap rate
- 8.82%
- Cash-on-cash
- 9.04%
- DSCR
- 1.40
- GRM
- 7.7
CMA / ARV
- ARV (median comp)
- $987,352
- List price
- $730,000
- Delta
- -26.06%
- Verdict
- UNDERPRICED
- Comps
- 7 within 1.0 mi
Show comp detail 1 sale within ~0.75 mi
| Address | Dist | Beds/Ba | Sqft | Sold | Price | $/sf | Match |
|---|---|---|---|---|---|---|---|
| 45 Rider Ave | 0.20mi | 5/2.0 | 1,870 (+1%) | 3mo | $726,000 | $388 | 83 |
Match score weights: distance 35% · size 25% · config 20% · recency 20%. Top-matched comps best support the ARV.
Projected returns pro-forma
-3.0% appreciation · 5.07% rent growth · sell at horizon
- IRR
- -0.4%
- Equity multiple
- 0.98×
- Total profit
- $-3,555
- Equity at exit
- $108,845
- IRR
- 11.2%
- Equity multiple
- 1.95×
- Total profit
- $194,457
- Equity at exit
- $63,117
Cash invested: $204,400 (down + closing). Projections, not guarantees.
Landlord ↔ Tenant lean methodology
- Overall (STATE)
- 15 Strongly Tenant-Friendly
- State New York
- 15 Strongly Tenant-Friendly · D+10
- County
- — inherits STATE
- City
- — inherits STATE
ZIP-level market 11772
- Rents YoY
- 5.1%
- Active inventory
- 216
- Price-to-rent
- 23.2×
Monthly cashflow live
- Estimated rent
- $7,874 high interval (Pro) →
- Mortgage (P&I)
- −$3,828
- Tax from tax record
- −$548 /mo · $6,573/yr
- Insurance
- −$304
- HOA
- −$0
- Vacancy / Maint / Mgmt
- −$1,654
- Net cashflow
- $1,540
Break-even live
3-unit breakdown (identical units grouped — click to expand)
| Units | Beds | Baths | Est. rent |
|---|---|---|---|
| 3× units | 2 | 1 | $7,875 |
| #1 | 2 | 1 | $2,625 |
| #2 | 2 | 1 | $2,625 |
| #3 | 2 | 1 | $2,625 |
| Total (3 units) | $7,874 | ||
UW: 25.0% down · 7.5% · 30yr · 1.5% tax · 5.0% vac · 8.0% maint · 8.0% mgmt
Financing live
Cash to close
- Down payment
- $182,500
- Closing costs
- $21,900
- Reserves months
- —
- Total cash needed
- —
Loan-product check · same deal, 3 products live
Conventional
25% down · 7.5% · 30yr
- Down + closing
- —
- Monthly P&I
- —
- Monthly cashflow
- —
- DSCR
- —
- Eligible?
- —
Personal DTI + credit; lowest rate.
DSCR
20% down · 8.5% · 30yr
- Down + closing
- —
- Monthly P&I
- —
- Monthly cashflow
- —
- DSCR
- —
- Eligible?
- —
No personal income docs; deal must DSCR.
Hard money
10% down · 12.0% · 12mo
- Down + closing
- —
- Monthly P&I
- —
- Monthly cashflow
- —
- DSCR
- —
- Eligible?
- —
Short-term bridge; refi at stabilization.
Listing history 6 events
-
2026-06-01days on market $730,000 Active 29 DOM
-
2026-05-31days on market $730,000 Active 28 DOM
-
2026-05-03$730,000 Active 245-char remark
-
2007-11-13soldstatus $339,350
-
1993-12-03soldstatus $97,500
-
1988-08-19soldstatus $100,000
ⓘ Source: listings_history table (triggers on properties + properties_extension) + one-shot
backfill from property_details.listing_events for pre-trigger history.
Tax reassessment forecast NY · Partial reset (capped growth)
- Current annual tax
- $6,573 · $548/mo
- Projected year-2 tax
- $9,455 · $788/mo
- Expected delta
- +$2,882/yr (+$240/mo · 43.8%)
ⓘ Screening estimate from a state-policy table — verify with the county assessor before closing.
Nearby sold comps map
Loading sold comps map…
Walkable amenities ~0.75 mi
Loading nearby amenities…
Taxation est. · year 1
- Rental income
- $94,488
- − Mortgage interest
- −$40,891
- − Property taxes
- −$6,573
- − Insurance
- −$3,650
- − Repairs & maintenance
- −$7,559
- − Management
- −$7,559
- − Depreciation
- −$21,236
- Taxable income
- $7,019
- Est. tax owed @ 24.0%
- −$1,685
- After-tax cash flow
- $16,799/yr
For passive investors: Depreciation is non-cash, so a rental often shows a tax loss while cash-flowing — sheltering income. Rental losses are passive: they offset passive income freely, and up to $25,000/yr can offset ordinary (W-2) income if you actively participate and your MAGI is under $100k (phasing out to $0 by $150k); unused losses carry forward. On sale, claimed depreciation is recaptured at up to 25%, and gains may owe capital-gains tax (a 1031 exchange can defer both). Figures are a year-1 estimate at your 24.0% rate — not tax advice; consult a CPA.
Schools (NCES district)
- District
- Patchogue-Medford Union Free School District
- NCES district ID
- 3622470
- Math proficiency
- 83% ▲ 27.00%
- Reading proficiency
- 69% ▲ 15.00%
- Median HH income
- $75,120
- Composite
- 66.81/100
- National rank
- #405
- State rank
- #73 of 590 in NY
Livability — East Patchogue
- Score
- 64/100
- State rank
- #769
- US rank
- #14732
Category grades
Schools grade is shown separately in the Schools card above.
Census & demographics
- Census place
- East Patchogue, NY
- County
- Suffolk County · 679,920 people
- City population
- 45,006
- Metro
- New York-Newark-Jersey City, NY-NJ-PA
- Population (ZIP)
- 45,023
- Household income
- $105,245
- Rent vs Own
- Severe rent burden
- 1595.0
Population outlook (Suffolk County) Hauer SSP2
- Today (2025)
- 1,505,262 people
- By 2030
- 1,498,318 · -0.5%
- By 2040
- 1,471,101 · -2.3%
- By 2050
- 1,424,848 · -5.3%
- By 2075
- 1,337,157 · -11.2%
- By 2100
- 1,217,720 · -19.1%
Race, ethnicity, and origin ACS 2023
- Neighborhood character
- Predominantly White (66%)
- Race & ethnicity
- White 66% Hispanic / Latino 24% Two or more races 8% Black 4% Asian 3%
- Hispanic origin (detail)
- Mexican 1% Puerto Rican 5% Dominican 2%
- Common ancestry
- Romanian 4% Lithuanian 2% Scotch-Irish 2%
- Foreign-born
- 15% · Canada, Jamaica, China
- Languages at home
- 78% English-only · Spanish 15% Other Asian/Pacific 2% Other Indo-European 1%
Political lean MEDSL · Suffolk
- 2024 margin
- Lean R (+10.0) · D 45.0% · R 55.0%
- 2008→2024 swing
- -16.0pp toward R · 2008: 6.0pp · 2024: -10.0pp
- All cycles
- 2024: R+10.0 2020: R+0.0 2016: R+8.2 2012: D+2.9 2008: D+6.0
Not yet ingested
- Civics
- —
Market trends
- HPI YoY
- ▼ -578.02%
- Current HPI
- 375.1174
- Rent YoY
- ▲ 5.07%
- Metro
- New York-Newark-Jersey City, NY-NJ-PA
- State GDP YoY
- ▲ 2.60%
- F500 in state
- 92
Industry mix (Fortune 500 HQ in NY)
| Industry | F500 HQs | Revenue |
|---|---|---|
| Financial Services | 10 | $950B |
|
||
| Consumer Goods | 9 | $162B |
|
||
| Insurance | 4 | $225B |
|
||
| Telecommunications | 2 | $144B |
|
||
| Pharmaceuticals | 2 | $112B |
|
||
| Media / Entertainment | 2 | $69B |
|
||
Price history
+630.0% since first listed5 events — show timeline
- 2026-06-02 Listing Removed — OneKey® MLS as Distributed by MLS Grid
- 2026-05-03 Listed $730,000 OneKey® MLS as Distributed by MLS Grid
- 2007-11-13 Sold (Public Records) $339,350 Public Records
- 1993-12-03 Sold (Public Records) $97,500 Public Records
- 1988-08-19 Sold (Public Records) $100,000 Public Records
Property tax history
+2.5%/yrLatest (2025): $6,573 · +0.0% YoY. Source: county tax records.
Cash-flow waterfall
monthlySold comps — $/sqft
last 12 mo · ≤1 miLoading sold comps…