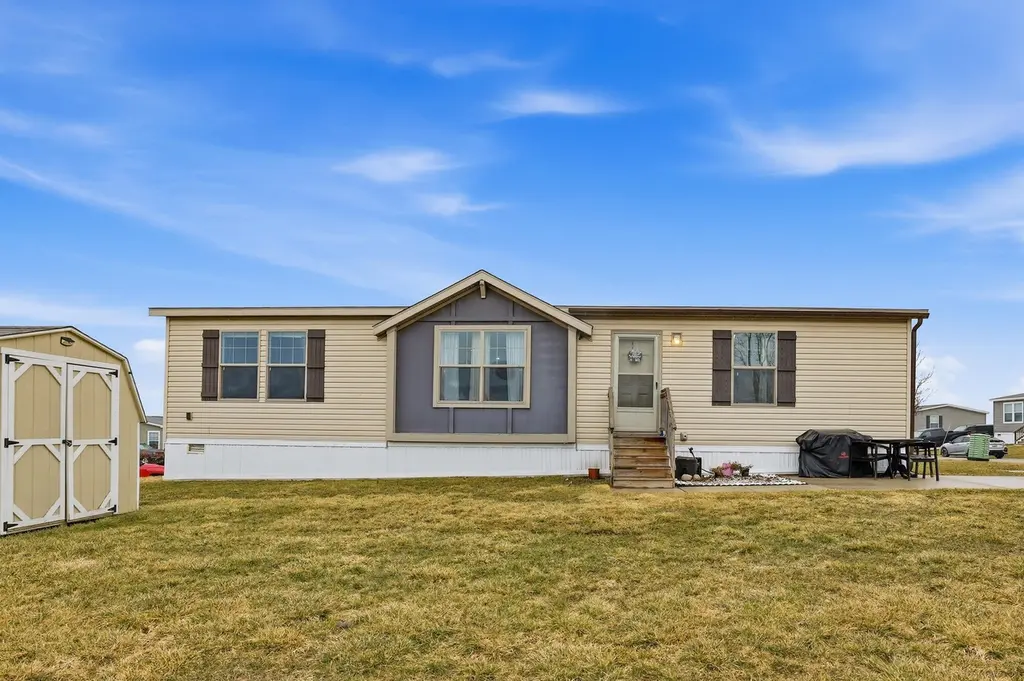
11608 Northern Shrs
Holland, MI 49424
$135,000C-
3 bd · 2.0 ba ·
1,680 sqft ·
Built 2018
· Manufactured
· Pending
· 16 DOM
Cashflow @ list (25.0% down · 7.5%)
Estimated rent
$2,196/mo
Mortgage (P&I)
−$708
Tax + insurance
−$225
HOA
−$750
Vac / Maint / Mgmt
−$461
Net cashflow
$52/mo
Annual
$625/yr
Cap rate
6.76%
Cash-on-cash
1.65%
DSCR
1.07
1% rule
1.63%
Cash to close
$37,800
Investor read
- This is a 3-bed/2.0-bath manufactured listed at $135k. Condition is rated good.
- At list price, monthly cash flow is $52 ($625/yr) — positive.
- The deal already cash-flows at list — no discount required.
- Meets the 1% rule at list price ($2k rent vs $135k).
- It's been on market 16 days — a 2% lower offer ($133k) is reasonable based on typical stale-listing flexibility.
- Recommended offer: $133k (1.5% below list) — sets the bar for market timing.
- Local home prices are declining (-3.0%/yr); year-one equity from $933 of loan paydown is wiped out by about $4k of value loss. Plan a longer hold.
- Location reads 82/100 on livability (#46 in MI, #1,066 nationally) — a professional / high-income tenant draw. Strengths: cost of living A+, housing A+, health & safety A+; Watch: amenities F.
- West Ottawa Public School District (suburban): math 37% / reading 52% proficiency, ranked #140 of 540 in MI (top 26%) — families likely to look elsewhere, expect single-tenant / working-renter base with shorter leases.
- Zoned schools: Macatawa Bay Middle School (math 29% / reading 46%, grade F, #243 of 493 statewide, top 50%, 646 students, 65% FRL); West Ottawa High School Campus (math 39% / reading 62%, grade D+, #146 of 713 statewide, top 21%, 2,196 students, 51% FRL).
- Watch-outs: HOA is 34% of rent.
- Market conditions: Rents rising fast (+5.1%/yr); 346 active listings in the ZIP; 3 comparable units currently listed for rent nearby; rentals leasing fast (median 5d on market — plan ~1-2 weeks tenant-placement turnaround); solid renter incomes; 1,237 units permitted in Ottawa County in 2024 (443 in 5+ unit buildings).
- Ottawa County population projected at +24% by 2050 — long-run rental-demand tailwind backs the buy-and-hold thesis.
- 3 sale attempts with the ask held roughly flat each time — persistent listings suggest the price (not the market) is what's stuck; bring a comps-based counter.
- Cap rate 6.8% vs local median 2.6% in Holland — top-decile yield for the area; either an underpriced asset or a hidden risk that comps aren't pricing in. Stress-test before assuming the spread holds.
- This rent runs 31% of the median local income ($85k/yr) — at the standard rent-burdened threshold; future hikes will face affordability resistance.
Questions for listing agent
- What does the HOA fee cover, when was the last increase, and are there any pending special assessments or reserve-fund shortfalls?
- Is there a deadline driving the sale (1031 exchange, divorce, estate, relocation)? That informs how much negotiation room exists.
- What's the average days-on-market for RENTAL listings here right now (not sales)? A rising rental-DOM trend means longer vacancies and softer asking-rent achievability than the comps imply.
- What's the recent tenant-quality profile in this submarket — average credit score on applications, eviction rate, late-payment / NSF rate, and stable-employment percentage? A property-management company in the area should have these aggregated.
- How much new for-sale + rental construction is in the pipeline within 1–3 miles? Heavy new supply typically softens prices + rents 12–24 months out; constrained supply supports both.
CashFlowRE · CFR-7KNR5D0V53SFNR
· Data 4 weeks ago
cashflowre.app · 2026-05-29