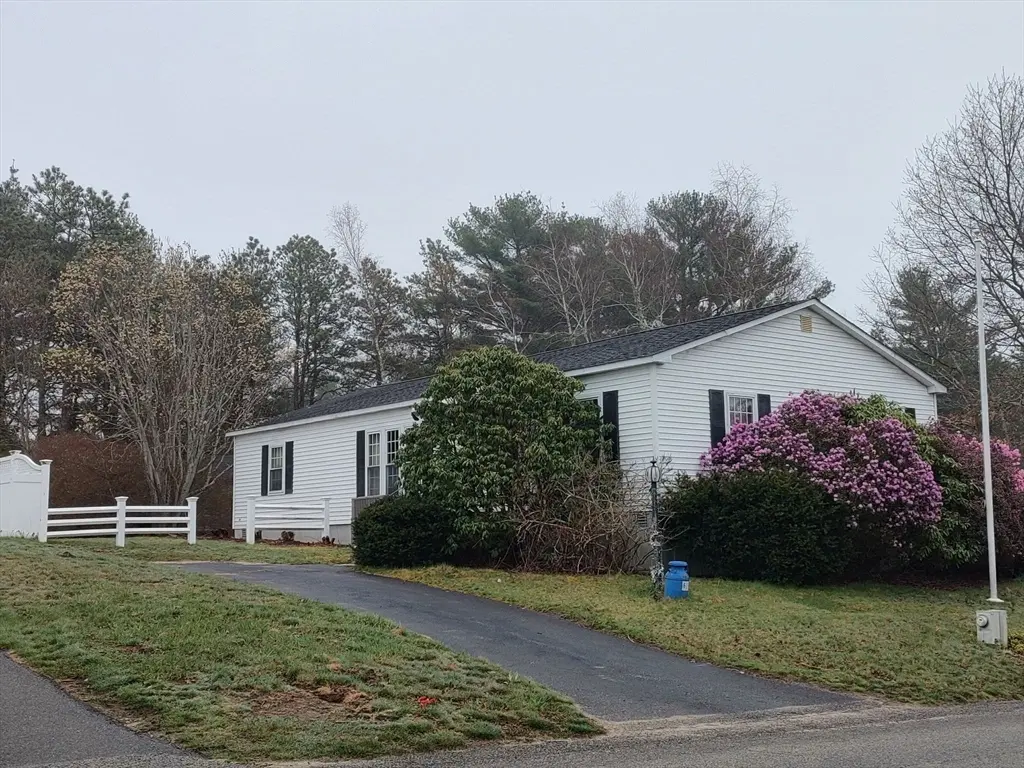
61 Pinehurst Dr
Plymouth, MA 02360
$269,000C-
3 bd · 2.0 ba ·
1,606 sqft ·
Built 1986
· Manufactured
· Active
· 56 DOM
Cashflow @ list (25.0% down · 7.5%)
Estimated rent
$3,224/mo
Mortgage (P&I)
−$1,411
Tax + insurance
−$515
HOA
−$600
Vac / Maint / Mgmt
−$677
Net cashflow
$22/mo
Annual
$262/yr
Cap rate
6.69%
Cash-on-cash
1.41%
DSCR
1.06
1% rule
1.20%
Cash to close
$75,320
Investor read
- This is a 3-bed/2.0-bath manufactured listed at $269k. Condition is rated average.
- At list price, monthly cash flow is $22 ($262/yr) — positive.
- The deal already cash-flows at list — no discount required.
- Meets the 1% rule at list price ($3k rent vs $269k).
- It's been on market 56 days — a 3% lower offer ($261k) is reasonable based on typical stale-listing flexibility.
- Recommended offer: $261k (3.0% below list) — sets the bar for market timing.
- Local home prices are declining (-3.0%/yr); year-one equity from $2k of loan paydown is wiped out by about $8k of value loss. Plan a longer hold.
- Location reads 78/100 on livability (#51 in MA, #2,590 nationally) — a middle-class / working-renter tenant base. Strengths: amenities A+, health & safety A, commute A-; Watch: cost of living F.
- Plymouth (suburban): math 35% / reading 54% proficiency, ranked #158 of 302 in MA (top 52%) — families likely to look elsewhere, expect single-tenant / working-renter base with shorter leases.
- Watch-outs: flood insurance adds $66/mo.
- Market conditions: Rents rising fast (+5.4%/yr); 238 active listings in the ZIP; high-income renter base; 1,255 units permitted in Plymouth County in 2024 (411 in 5+ unit buildings).
- Climate carrying-cost: severe flood risk; severe wind risk, 80% chance of damaging wind over 30y; extreme-heat days projected 7→15/yr by 2055 (HVAC capex compounding) — expect insurance premiums to compound above CPI over the hold.
- Cap rate 6.7% vs local median 2.0% in Plymouth — top-decile yield for the area; either an underpriced asset or a hidden risk that comps aren't pricing in. Stress-test before assuming the spread holds.
- This rent runs 33% of the median local income ($117k/yr) — at the standard rent-burdened threshold; future hikes will face affordability resistance.
Questions for listing agent
- It's been on market 56 days. Have you received any prior offers? Is the seller open to a 3% concession, seller financing, or rate buy-down credit?
- What's the actual annual flood-insurance premium (NFIP or private), and is the property in a SFHA with mandatory coverage?
- What does the HOA fee cover, when was the last increase, and are there any pending special assessments or reserve-fund shortfalls?
- Is there a deadline driving the sale (1031 exchange, divorce, estate, relocation)? That informs how much negotiation room exists.
- What's the average days-on-market for RENTAL listings here right now (not sales)? A rising rental-DOM trend means longer vacancies and softer asking-rent achievability than the comps imply.
- What's the recent tenant-quality profile in this submarket — average credit score on applications, eviction rate, late-payment / NSF rate, and stable-employment percentage? A property-management company in the area should have these aggregated.
- How much new for-sale + rental construction is in the pipeline within 1–3 miles? Heavy new supply typically softens prices + rents 12–24 months out; constrained supply supports both.
Repairs flagged (vision-AI assessment)
- Minor: Kitchen backsplash — No backsplash visible
- Minor: Kitchen appliances — Older style appliances
CashFlowRE · CFR-7KVXZPERE71VZN
· Data 1 day ago
cashflowre.app · 2026-05-29