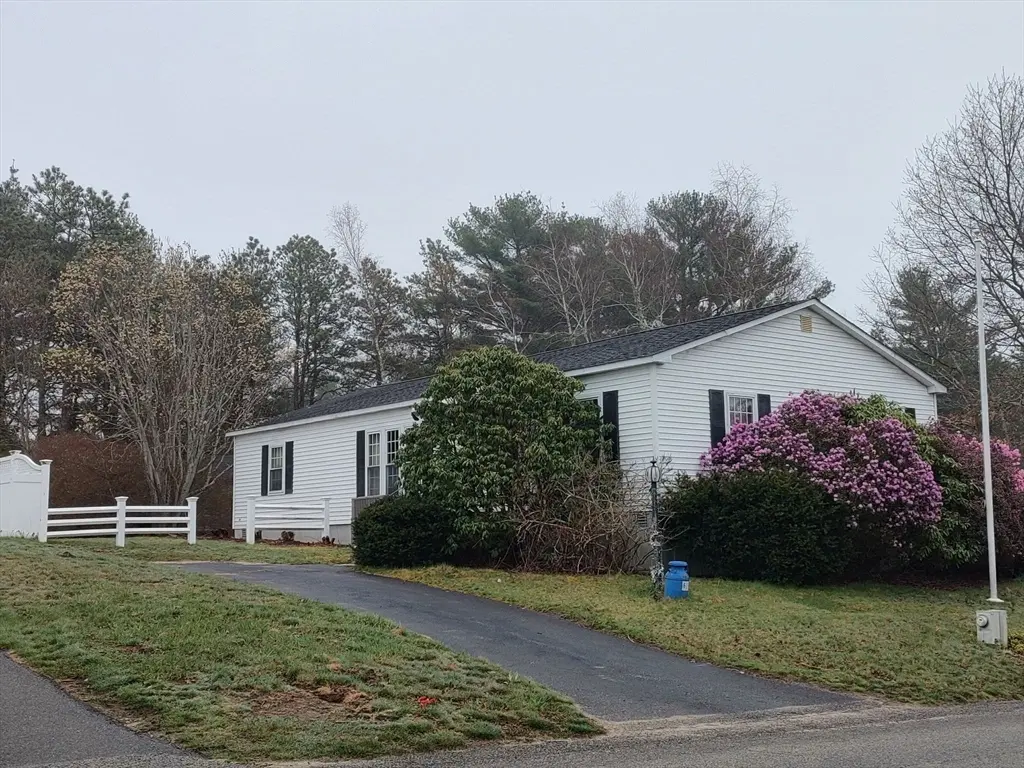
61 Pinehurst Dr · Plymouth, MA
Flood risk 9/10 · Severe
- FEMA flood zone
- X (unshaded)
- Chance of flooding over 30 yrs
- 0.99%
- Est. flood insurance / yr
- $507 – $1,088
Fire risk 1/10 · Minimal
- Est. fire insurance / yr
- $915 – $1,699
Heat risk 5/10 · Moderate
- Hot days now (above 95°F)
- 7 days/yr
- Hot days in 30 yrs
- 15 days/yr
Wind risk 8/10 · Major
- Chance of severe wind over 30 yrs
- 80.0%
Air-quality risk 2/10 · Minimal
- Unhealthy air days now
- 1 days/yr
- Unhealthy air days in 30 yrs
- 1 days/yr
Risk factors via First Street. Map © Google.
Why this score? — see what drove the C- grade
The composite is a weighted blend of 9 inputs, each scored 0–100. Each bar is that input's sub-score; the figure is the points it added to the 100-point composite (weight × sub-score).
- Cash flow +15.1/30.0
- ARV discount +11.5/15.0
- 1% rule +7.0/10.0
- DSCR +4.6/10.0
- Schools +4.1/10.0
- Rent growth +3.9/5.0
- Livability +3.9/5.0
- Condition / age +2.8/5.0
- Appreciation +0.0/10.0
$269,000
🖨 Deal sheet 📄 Offer letter ✓ Due diligence
Listing remarks
Wonderful opportunity to get a spacious 3 bedroom, 2 bath unit in Pinehurst Village 55+ community for an attractive price. Neutral walls (no paneling) encourage you to decorate and update as needed to your taste. Nice setting/curb appeal with vinyl fencing for desirable yard privacy. Bonus SECOND driveway in rear with just 2 steps in. Two possible sheds. Sunroom addition with wood ceiling. Plenty of closets. Warm kitchen with bonus countertop breakfast bar. Spacious rooms for your large furniture pieces. Per seller, heat & AC updated in 2002, hot water replaced 2026. Pinehurst Village has a clubhouse with a library, laundromat, billiard room, and a large function area. Inground pool
Key facts
- Wood ceiling
- Sunroom addition
- Two possible sheds
Tags
Property features AI
Finance
- Other: Located in Pinehurst Village (55+ community)
- HOA & community: Homeowners association membership required; Association fee of $600; 55+ / senior community
Exterior
- Parking: Open/off-street paved parking with three spaces; Exclusive paved driveway parking
- Utilities: Public water; Private sewer; Electric service with circuit breakers; Electric range capability; Electric dryer hookup; Washer hookup
- Home design: Modular single-family home; One-story/main-level living; White exterior
- Construction: Built by builder (year built: actual); Slab foundation; Shingle roof; Modular construction
- Exterior features: Fenced yard; Storage; Gentle sloping lot; Paved road access
Interior
- Kitchen: Skylight; Vinyl flooring; Range; Dishwasher; Disposal; Refrigerator
- Bedrooms: Three main-level bedrooms; Primary bedroom with walk-in closet and 3/4 bathroom (main level); Bedrooms feature wall-to-wall carpet
- Flooring: Vinyl flooring in kitchen, laundry, and bath; Wall-to-wall carpet in main living areas and bedrooms
- Bathrooms: Two full bathrooms (both on main level); Primary bathroom: 3/4 bath; Main bathroom with tub and shower, skylight, linen closet, vinyl flooring, and stone/granite/solid countertops; Second bathroom with shower stall
- Heating & cooling: Central heating (propane); Central air conditioning
- Interior features: Seven total rooms; Closets throughout; Vestibule; Sun room; Foyer; Ceiling fans in living and dining areas; Vaulted ceilings in living and dining areas
- Laundry & utility: First-floor laundry area; Washer hookup; Electric dryer hookup; Laundry area with vinyl flooring
Neighborhood map
What this means for you Summary
Snapshot
- This is a 3-bed/2.0-bath manufactured listed at $269k. Condition is rated average.
Deal economics
- At list price, monthly cash flow is $22 ($262/yr) — positive.
- The deal already cash-flows at list — no discount required.
- Meets the 1% rule at list price ($3k rent vs $269k).
- Recommended offer: $261k (3.0% below list) — sets the bar for market timing.
- Cap rate 6.7% vs local median 2.0% in Plymouth — top-decile yield for the area; either an underpriced asset or a hidden risk that comps aren't pricing in. Stress-test before assuming the spread holds.
Location & tenants
- Location reads 78/100 on livability (#51 in MA, #2,590 nationally) — a middle-class / working-renter tenant base. Strengths: amenities A+, health & safety A, commute A-; Watch: cost of living F.
- Plymouth (suburban): math 35% / reading 54% proficiency, ranked #158 of 302 in MA (top 52%) — families likely to look elsewhere, expect single-tenant / working-renter base with shorter leases.
- Market conditions: Rents rising fast (+5.4%/yr); 238 active listings in the ZIP; high-income renter base; 1,255 units permitted in Plymouth County in 2024 (411 in 5+ unit buildings).
- This rent runs 33% of the median local income ($117k/yr) — at the standard rent-burdened threshold; future hikes will face affordability resistance.
Forward outlook
- Local home prices are declining (-3.0%/yr); year-one equity from $2k of loan paydown is wiped out by about $8k of value loss. Plan a longer hold.
Negotiation context
- It's been on market 56 days — a 3% lower offer ($261k) is reasonable based on typical stale-listing flexibility.
Risks & watch-outs
- Watch-outs: flood insurance adds $66/mo.
- Climate carrying-cost: severe flood risk; severe wind risk, 80% chance of damaging wind over 30y; extreme-heat days projected 7→15/yr by 2055 (HVAC capex compounding) — expect insurance premiums to compound above CPI over the hold.
Questions for the listing agent
- It's been on market 56 days. Have you received any prior offers? Is the seller open to a 3% concession, seller financing, or rate buy-down credit?
- What's the actual annual flood-insurance premium (NFIP or private), and is the property in a SFHA with mandatory coverage?
- What does the HOA fee cover, when was the last increase, and are there any pending special assessments or reserve-fund shortfalls?
- Is there a deadline driving the sale (1031 exchange, divorce, estate, relocation)? That informs how much negotiation room exists.
- What's the average days-on-market for RENTAL listings here right now (not sales)? A rising rental-DOM trend means longer vacancies and softer asking-rent achievability than the comps imply.
- What's the recent tenant-quality profile in this submarket — average credit score on applications, eviction rate, late-payment / NSF rate, and stable-employment percentage? A property-management company in the area should have these aggregated.
- How much new for-sale + rental construction is in the pipeline within 1–3 miles? Heavy new supply typically softens prices + rents 12–24 months out; constrained supply supports both.
Investment metrics
- 1% rule
- 1.20% ✓
- Cap rate
- 6.69%
- Cash-on-cash
- 1.41%
- DSCR
- 1.06
- GRM
- 7.0
CMA / ARV
- ARV (median comp)
- $295,021
- List price
- $269,000
- Delta
- -8.82%
- Verdict
- FAIR
- Comps
- 20 within 1.0 mi
Show comp detail 5 sales within ~0.75 mi
| Address | Dist | Beds/Ba | Sqft | Sold | Price | $/sf | Match |
|---|---|---|---|---|---|---|---|
| 49 Snowgoose Ln | 0.09mi | 3/2.0 | 1,700 (+6%) | 7mo | $318,500 | $187 | 80 |
| 55 Pinehurst Dr | 0.26mi | 3/2.0 | 1,456 (-9%) | 5mo | $294,000 | $202 | 68 |
| 59 Pinehurst Dr | 0.26mi | 3/2.0 | 1,568 (-2%) | 19mo | $290,000 | $185 | 68 |
| 65 Pinehurst Dr | 0.26mi | 3/2.0 | 1,568 (-2%) | 19mo | $276,000 | $176 | 68 |
| 3 Narragansett Dr | 0.24mi | 3/1.0 | 1,568 (-2%) | 20mo | $321,600 | $205 | 65 |
Match score weights: distance 35% · size 25% · config 20% · recency 20%. Top-matched comps best support the ARV.
Projected returns pro-forma
-3.0% appreciation · 5.43% rent growth · sell at horizon
- IRR
- -12.0%
- Equity multiple
- 0.55×
- Total profit
- $-33,663
- Equity at exit
- $40,109
- IRR
- 1.5%
- Equity multiple
- 1.12×
- Total profit
- $9,169
- Equity at exit
- $23,258
Cash invested: $75,320 (down + closing). Projections, not guarantees.
Landlord ↔ Tenant lean methodology
- Overall (STATE)
- 20 Strongly Tenant-Friendly
- State Massachusetts
- 20 Strongly Tenant-Friendly · D+15
- County
- — inherits STATE
- City
- — inherits STATE
ZIP-level market 02360
- Rents YoY
- 5.4%
- Active inventory
- 238
- Price-to-rent
- 7.0×
Monthly cashflow live
- Estimated rent
- $3,224 medium interval (Pro) →
- Mortgage (P&I)
- −$1,411
- Tax est. 1.5%
- −$336 /mo · $4,035/yr
- Insurance
- −$112
- Flood insurance flood zone
- −$66 /mo · $798/yr
- HOA
- −$600
- Vacancy / Maint / Mgmt
- −$677
- Net cashflow
- $22
Break-even live
UW: 25.0% down · 7.5% · 30yr · 1.5% tax · 5.0% vac · 8.0% maint · 8.0% mgmt
Financing live
Cash to close
- Down payment
- $67,250
- Closing costs
- $8,070
- Reserves months
- —
- Total cash needed
- —
Loan-product check · same deal, 3 products live
Conventional
25% down · 7.5% · 30yr
- Down + closing
- —
- Monthly P&I
- —
- Monthly cashflow
- —
- DSCR
- —
- Eligible?
- —
Personal DTI + credit; lowest rate.
DSCR
20% down · 8.5% · 30yr
- Down + closing
- —
- Monthly P&I
- —
- Monthly cashflow
- —
- DSCR
- —
- Eligible?
- —
No personal income docs; deal must DSCR.
Hard money
10% down · 12.0% · 12mo
- Down + closing
- —
- Monthly P&I
- —
- Monthly cashflow
- —
- DSCR
- —
- Eligible?
- —
Short-term bridge; refi at stabilization.
HOA detail
- Monthly dues
- $600 · $7,200/yr
- Likely covers
- waterpool
Listing history 15 events
-
2026-06-18days on market $269,000 Active 56 DOM
-
2026-06-17days on market $269,000 Active 55 DOM
-
2026-06-16days on market $269,000 Active 54 DOM
-
2026-06-15days on market $269,000 Active 53 DOM
-
2026-06-13days on market $269,000 Active 51 DOM
-
2026-06-13days on market $269,000 Active 50 DOM
-
2026-06-09days on market $269,000 Active 47 DOM
-
2026-06-08days on market $269,000 Active 46 DOM
-
2026-06-08days on market $269,000 Active 45 DOM
-
2026-06-04days on market $269,000 Active 42 DOM
-
2026-06-03days on market $269,000 Active 41 DOM
-
2026-06-02days on market $269,000 Active 40 DOM
-
2026-06-01days on market $269,000 Active 39 DOM
-
2026-05-31days on market $269,000 Active 38 DOM
-
2026-04-23$269,000 New 1008-char remark
ⓘ Source: listings_history table (triggers on properties + properties_extension) + one-shot
backfill from property_details.listing_events for pre-trigger history.
Climate risk First Street
- Flood 9/10 Extreme FEMA zone X (unshaded) · 99% chance over 30 yrs
- Wildfire 1/10 Low
- Heat 5/10 Major 7 d/yr ≥95°F today · 15 d/yr by 30 yrs out
- Wind 8/10 Severe 80% chance of damaging wind over 30 yrs
- Air quality 2/10 Low 1 unhealthy d/yr today · 1 by 30 yrs out
Nearby sold comps map
Loading sold comps map…
Walkable amenities ~0.75 mi
Loading nearby amenities…
Taxation est. · year 1
- Rental income
- $38,694
- − Mortgage interest
- −$15,068
- − Property taxes
- −$4,035
- − Insurance
- −$2,142
- − Repairs & maintenance
- −$3,095
- − Management
- −$3,095
- − HOA
- −$7,200
- − Depreciation
- −$7,825
- Taxable loss
- −$3,768
- Est. tax savings @ 24.0%
- +$904
- After-tax cash flow
- $1,167/yr
For passive investors: Depreciation is non-cash, so a rental often shows a tax loss while cash-flowing — sheltering income. Rental losses are passive: they offset passive income freely, and up to $25,000/yr can offset ordinary (W-2) income if you actively participate and your MAGI is under $100k (phasing out to $0 by $150k); unused losses carry forward. On sale, claimed depreciation is recaptured at up to 25%, and gains may owe capital-gains tax (a 1031 exchange can defer both). Figures are a year-1 estimate at your 24.0% rate — not tax advice; consult a CPA.
Condition & rehab AI · 12 photos
This home is in average condition with cosmetic updates needed. It has a spacious layout and a desirable setting, making it a good investment opportunity.
Repairs flagged
- Minor Kitchen backsplash — No backsplash visible
- Minor Kitchen appliances — Older style appliances
Value-add opportunities
- Both Paint interior walls — Fresh paint enhances curb appeal and interior aesthetics
- Both Replace kitchen backsplash — A new backsplash can modernize the kitchen and add value
- Both Clean carpets — Clean carpets improve the home's appearance and can attract more buyers
Renovation cost estimate screening
| Repair item | Severity | Est. cost |
|---|---|---|
| Kitchen backsplash · No backsplash visible | Minor | $500–3,000 |
| Kitchen appliances · Older style appliances | Minor | $500–3,000 |
| Total estimated repair cost · 2 items | $1,000–6,000 |
Value-add ROI direction
- Both Paint interior walls — Fresh paint enhances curb appeal and interior aesthetics ↑
- Both Replace kitchen backsplash — A new backsplash can modernize the kitchen and add value ↑
- Both Clean carpets — Clean carpets improve the home's appearance and can attract more buyers ↑
ⓘ Cost ranges are severity-bucket heuristics (US national rule-of-thumb). Get contractor quotes + a written scope before underwriting a rehab budget.
Schools (NCES district)
- District
- Plymouth
- NCES district ID
- 2509720
- Math proficiency
- 35% ▼ -12.00%
- Reading proficiency
- 54% ▼ -2.00%
- Median HH income
- $77,630
- Composite
- 40.79/100
- National rank
- #3640
- State rank
- #158 of 302 in MA
Livability — Plymouth
- Score
- 78/100
- State rank
- #51
- US rank
- #2590
Category grades
Schools grade is shown separately in the Schools card above.
Census & demographics
- County
- Plymouth County · 358,589 people
- City population
- 63,689
- Metro
- Boston-Cambridge-Newton, MA-NH
- Population (ZIP)
- 63,689
- Household income
- $116,941
- Rent vs Own
- Severe rent burden
- 1655.0
Population outlook (Plymouth County) Hauer SSP2
- Today (2025)
- 533,105 people
- By 2030
- 541,862 · +1.6%
- By 2040
- 549,791 · +3.1%
- By 2050
- 542,476 · +1.8%
- By 2075
- 518,429 · -2.8%
- By 2100
- 448,179 · -15.9%
Race, ethnicity, and origin ACS 2023
- Neighborhood character
- Predominantly White (88%)
- Race & ethnicity
- White 88% Two or more races 5% Hispanic / Latino 3% Black 1% Asian 1%
- Common ancestry
- Russian 6% Lithuanian 4% Romanian 3%
- Foreign-born
- 6% · Canada, Vietnam
- Languages at home
- 92% English-only · Other Indo-European 4% Spanish 2% Vietnamese 1%
Political lean MEDSL · Plymouth
- 2024 margin
- Lean D (+8.8) · D 53.6% · R 44.7% · Other 1.7%
- 2008→2024 swing
- +1.3pp toward D · 2008: 7.6pp · 2024: 8.8pp
- All cycles
- 2024: D+8.8 2020: D+17.4 2016: D+7.2 2012: D+3.8 2008: D+7.6
Not yet ingested
- Civics
- —
Market trends
- HPI YoY
- ▼ -495.82%
- Current HPI
- 306.0925
- Rent YoY
- ▲ 5.43%
- Metro
- Boston-Cambridge-Newton, MA-NH
- State GDP YoY
- ▲ 2.28%
- F500 in state
- 38
Industry mix (Fortune 500 HQ in MA)
| Industry | F500 HQs | Revenue |
|---|---|---|
| Technology | 3 | $17B |
|
||
| Insurance | 2 | $84B |
|
||
| Retail | 2 | $76B |
|
||
| Life Sciences | 1 | $43B |
|
||
| Energy Technology | 1 | $31B |
|
||
| Aerospace / Defense | 1 | $18B |
|
||
Price history
1 event — show timeline
- 2026-04-23 Listed $269,000 MLS PIN
Cash-flow waterfall
monthlySold comps — $/sqft
last 12 mo · ≤1 miLoading sold comps…