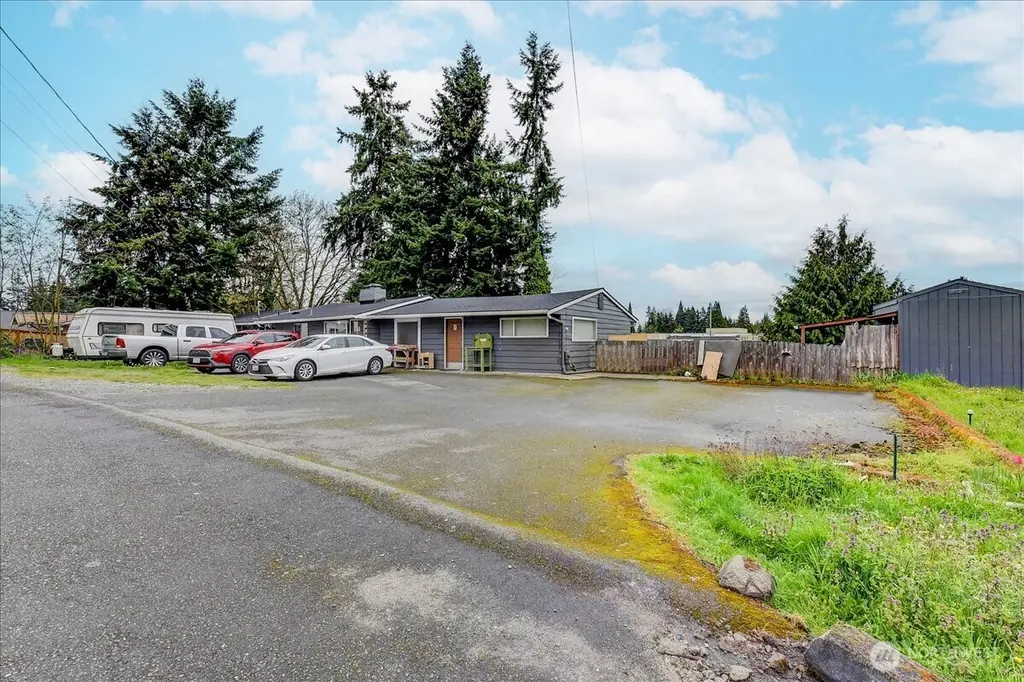
6629 204th St SW
Lynnwood, WA 98036
$549,000D+
5 bd · 2.0 ba ·
2,648 sqft ·
Built 1956
· MultiFamily
· Pending
· 3 DOM
Cashflow @ list (25.0% down · 7.5%)
Estimated rent
$4,407/mo
Mortgage (P&I)
−$2,879
Tax + insurance
−$714
HOA
−$0
Vac / Maint / Mgmt
−$925
Net cashflow
$-112/mo
Annual
$-1,339/yr
Cap rate
6.05%
Cash-on-cash
-0.87%
DSCR
0.96
1% rule
0.80%
Cash to close
$153,720
Investor read
- This is a 2 × 2-bed/2.0-bath units multifamily listed at $549k.
- At list price, monthly cash flow is $-112 ($-1k/yr) — negative. Per door: $-56/mo.
- To cash-flow at today's rent, offer at most $529k (3.6% below list).
- To meet the 1% rule (rent ≥ 1% of price), the offer needs to be $441k (19.7% below list).
- Only 3 days on market — expect competitive offers; lowballing is unlikely to land.
- Recommended offer: $441k (19.7% below list) — sets the bar for 1% rule.
- Local home prices are declining (-3.0%/yr); year-one equity from $4k of loan paydown is wiped out by about $16k of value loss. Plan a longer hold.
- Location reads 77/100 on livability (#150 in WA, #3,226 nationally) — a middle-class / working-renter tenant base. Strengths: commute A+, health & safety A+, employment A; Watch: crime F, cost of living F.
- Edmonds School District (suburban): math 54% / reading 65% proficiency, ranked #53 of 291 in WA (top 18%) — acceptable for families but not a draw, mixed tenant base, ~2y average lease.
- Watch-outs: built in 1956 — expect roof / HVAC / electrical / plumbing capex.
- Market conditions: Rents rising (+2.2%/yr); 188 active listings in the ZIP; 2 comparable units currently listed for rent nearby; solid renter incomes; 3,982 units permitted in Snohomish County in 2024 (1,492 in 5+ unit buildings).
- Snohomish County population projected at +30% by 2050 — long-run rental-demand tailwind backs the buy-and-hold thesis.
- 2 sale attempts since 21y ago with the ask held roughly flat each time — persistent listings suggest the price (not the market) is what's stuck; bring a comps-based counter.
- Current owner paid $270k; list at $549k implies a 103% gain — meaningful room to come down on a strong offer.
- Cap rate 6.0% vs local median 2.2% in Lynnwood — top-decile yield for the area; either an underpriced asset or a hidden risk that comps aren't pricing in. Stress-test before assuming the spread holds.
- At $4,407/mo this rent would consume 59% of the median local household income ($89k/yr) (locally 1781% of renters already pay >50% of income on rent) — very limited rent-growth headroom before tenants either downsize or default.
Questions for listing agent
- What do current leases actually rent for vs. the listed asking? Can we see a recent rent roll and the last 12 months of T-12 income?
- Can we see the unit-by-unit rent roll, current vacancy, and any below-market leases? What's the average tenancy length?
- What capital expenditures (roof, boiler, parking lot, exteriors) have been made in the last 5 years, and what's planned in the next 2?
- Built in 1956 — when were the roof, HVAC, electrical panel, plumbing, and water heater last replaced?
- Is there a deadline driving the sale (1031 exchange, divorce, estate, relocation)? That informs how much negotiation room exists.
- Crime grade is F in this area — have there been break-ins, vandalism, or insurance claims at this property in the last 3 years? What carrier currently insures it and at what premium?
- The area grade is low — what's the realistic commute time and amenity access for the typical tenant pool here? Any planned neighborhood developments (good or bad) we should know about?
- What's the average days-on-market for RENTAL listings here right now (not sales)? A rising rental-DOM trend means longer vacancies and softer asking-rent achievability than the comps imply.
CashFlowRE · CFR-7MV557BF5ZDV0X
· Data 3 weeks ago
cashflowre.app · 2026-05-29