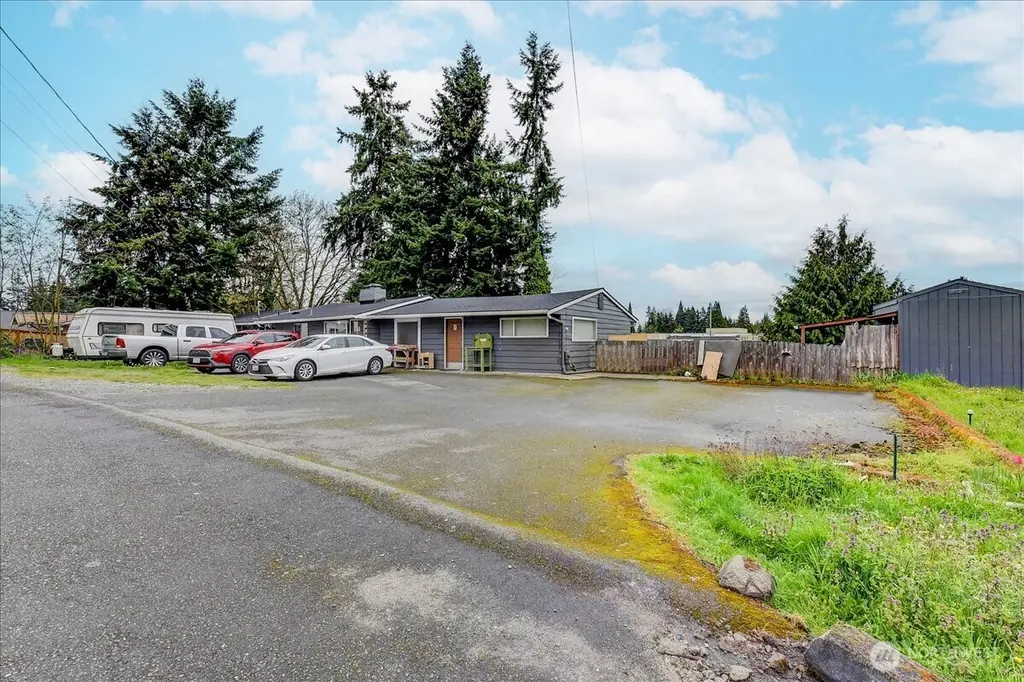
 Duplex
6629 204th St SW · Lynnwood, WA
Flood risk 1/10 · Minimal
- FEMA flood zone
- X (unshaded)
- Chance of flooding over 30 yrs
- 0.0%
- Est. flood insurance / yr
- $473 – $860
Fire risk 1/10 · Minimal
- Est. fire insurance / yr
- $604 – $1,122
Heat risk 3/10 · Minor
- Hot days now (above 86°F)
- 7 days/yr
- Hot days in 30 yrs
- 15 days/yr
Wind risk 1/10 · Minimal
- Chance of severe wind over 30 yrs
- —
Air-quality risk 6/10 · Moderate
- Unhealthy air days now
- 9 days/yr
- Unhealthy air days in 30 yrs
- 10 days/yr
Risk factors via First Street. Map © Google.
Why this score? — see what drove the D+ grade
The composite is a weighted blend of 9 inputs, each scored 0–100. Each bar is that input's sub-score; the figure is the points it added to the 100-point composite (weight × sub-score).
- ARV discount +15.0/15.0
- Cash flow +12.2/30.0
- Schools +5.4/10.0
- Livability +3.9/5.0
- DSCR +3.6/10.0
- Rent growth +3.1/5.0
- 1% rule +3.0/10.0
- Condition / age +2.5/5.0
- Appreciation +0.0/10.0
$549,000
🖨 Deal sheet (PDF) 📄 Offer letter ✓ Due diligence
Multi-family units
County records classify this as Multi-Family (2-4 Unit). Listing-text estimate: 2 units. confirmed
Listing remarks
Contractor/Developer Special! Sold As Is. Unbeatable Location & Endless Potential – Zoned CDM!Unlock the ultimate investment or multi-generational living opportunity with this versatile duplex. Situated on an expansive 12,000+ sq. ft. lot and boasting CDM zoning, this property offers incredible future development potential. Whether you’re looking to build equity through a renovation or explore high-density possibilities, this is the canvas you’ve been waiting for! Unit A: A bright living area, kitchen, dining room, and dedicated laundry space. A convenient half-bath is located here, along with a slider leading to a brand-new deck—perfect for BBQing in the larg
Key facts
- Expansive lot
- Brand-new deck
- Private patio
Tags
Neighborhood map
What this means for you Summary
Snapshot
- This is a 2 × 2-bed/2.0-bath units multifamily listed at $549k.
Deal economics
- At list price, monthly cash flow is $-112 ($-1k/yr) — negative. Per door: $-56/mo.
- To cash-flow at today's rent, offer at most $529k (3.6% below list).
- To meet the 1% rule (rent ≥ 1% of price), the offer needs to be $441k (19.7% below list).
- Recommended offer: $441k (19.7% below list) — sets the bar for 1% rule.
- Cap rate 6.0% vs local median 2.2% in Lynnwood — top-decile yield for the area; either an underpriced asset or a hidden risk that comps aren't pricing in. Stress-test before assuming the spread holds.
Location & tenants
- Location reads 77/100 on livability (#150 in WA, #3,226 nationally) — a middle-class / working-renter tenant base. Strengths: commute A+, health & safety A+, employment A; Watch: crime F, cost of living F.
- Edmonds School District (suburban): math 54% / reading 65% proficiency, ranked #53 of 291 in WA (top 18%) — acceptable for families but not a draw, mixed tenant base, ~2y average lease.
- Market conditions: Rents rising (+2.2%/yr); 184 active listings in the ZIP; 2 comparable units currently listed for rent nearby; solid renter incomes; 3,982 units permitted in Snohomish County in 2024 (1,492 in 5+ unit buildings).
- At $4,407/mo this rent would consume 59% of the median local household income ($89k/yr) (locally 1781% of renters already pay >50% of income on rent) — very limited rent-growth headroom before tenants either downsize or default.
Forward outlook
- Local home prices are declining (-3.0%/yr); year-one equity from $4k of loan paydown is wiped out by about $16k of value loss. Plan a longer hold.
- Snohomish County population projected at +30% by 2050 — long-run rental-demand tailwind backs the buy-and-hold thesis.
Negotiation context
- Only 3 days on market — expect competitive offers; lowballing is unlikely to land.
- 2 sale attempts since 21y ago with the ask held roughly flat each time — persistent listings suggest the price (not the market) is what's stuck; bring a comps-based counter.
- Current owner paid $270k; list at $549k implies a 103% gain — meaningful room to come down on a strong offer.
Risks & watch-outs
- Watch-outs: built in 1956 — expect roof / HVAC / electrical / plumbing capex.
Questions for the listing agent
- What do current leases actually rent for vs. the listed asking? Can we see a recent rent roll and the last 12 months of T-12 income?
- Can we see the unit-by-unit rent roll, current vacancy, and any below-market leases? What's the average tenancy length?
- What capital expenditures (roof, boiler, parking lot, exteriors) have been made in the last 5 years, and what's planned in the next 2?
- Built in 1956 — when were the roof, HVAC, electrical panel, plumbing, and water heater last replaced?
- Is there a deadline driving the sale (1031 exchange, divorce, estate, relocation)? That informs how much negotiation room exists.
- Crime grade is F in this area — have there been break-ins, vandalism, or insurance claims at this property in the last 3 years? What carrier currently insures it and at what premium?
- The area grade is low — what's the realistic commute time and amenity access for the typical tenant pool here? Any planned neighborhood developments (good or bad) we should know about?
- What's the average days-on-market for RENTAL listings here right now (not sales)? A rising rental-DOM trend means longer vacancies and softer asking-rent achievability than the comps imply.
- What's the recent tenant-quality profile in this submarket — average credit score on applications, eviction rate, late-payment / NSF rate, and stable-employment percentage? A property-management company in the area should have these aggregated.
- How much new apartment / multifamily construction is in the pipeline within 1–3 miles? Heavy new supply (>2% of stock underway) typically softens rents 12–24 months out; light construction supports rent growth.
Investment metrics
- 1% rule
- 0.80% ✗
- Cap rate
- 6.05%
- Cash-on-cash
- -0.87%
- DSCR
- 0.96
- GRM
- 10.4
CMA / ARV
- ARV (on-the-fly)
- $831,472
- Comps found
- 2
Show comp detail 2 sales within ~0.75 mi
| Address | Dist | Beds/Ba | Sqft | Sold | Price | $/sf | Match |
|---|---|---|---|---|---|---|---|
| 6629 204th St SW | 0.00mi | 4/3.0 (-1) | 2,648 (0%) | 1mo | $565,000 | $213 | 90 |
| 6303 194th St SW | 0.62mi | 4/2.0 (-1) | 2,436 (-8%) | 2mo | $765,000 | $314 | 51 |
Match score weights: distance 35% · size 25% · config 20% · recency 20%. Top-matched comps best support the ARV.
Projected returns pro-forma
-3.0% appreciation · 2.25% rent growth · sell at horizon
- IRR
- -18.5%
- Equity multiple
- 0.35×
- Total profit
- $-99,425
- Equity at exit
- $81,858
- IRR
- -12.4%
- Equity multiple
- 0.29×
- Total profit
- $-109,301
- Equity at exit
- $47,467
Cash invested: $153,720 (down + closing). Projections, not guarantees.
Landlord ↔ Tenant lean methodology
- Overall (STATE)
- 28 Tenant-Leaning
- State Washington
- 28 Tenant-Leaning · D+8
- County
- — inherits STATE
- City
- — inherits STATE
ZIP-level market 98036
- Rents YoY
- 2.2%
- Active inventory
- 184
- Price-to-rent
- 20.8×
Monthly cashflow live
- Estimated rent
- $4,407 high interval (Pro) →
- Mortgage (P&I)
- −$2,879
- Tax from tax record
- −$485 /mo · $5,824/yr
- Insurance
- −$229
- HOA
- −$0
- Vacancy / Maint / Mgmt
- −$925
- Net cashflow
- $-112
Break-even live
Sensitivity live
| Price | -10% $199 | -5% $44 | +0% $-112 | +5% $-267 | +10% $-422 |
|---|---|---|---|---|---|
| Rent | -10% $-460 | -5% $-286 | +0% $-112 | +5% $63 | +10% $237 |
| Rate | -1.0pp $165 | -0.5pp $28 | base $-112 | +0.5pp $-254 | +1.0pp $-399 |
2-unit breakdown (identical units grouped — click to expand)
| Units | Beds | Baths | Est. rent |
|---|---|---|---|
| 2× units | 2 | 2 | $4,408 |
| #1 | 2 | 2 | $2,204 |
| #2 | 2 | 2 | $2,204 |
| Total (2 units) | $4,407 | ||
UW: 25.0% down · 7.5% · 30yr · 1.5% tax · 5.0% vac · 8.0% maint · 8.0% mgmt
Financing live
Cash to close
- Down payment
- $137,250
- Closing costs
- $16,470
- Reserves months
- —
- Total cash needed
- —
Loan-product check · same deal, 3 products live
Conventional
25% down · 7.5% · 30yr
- Down + closing
- —
- Monthly P&I
- —
- Monthly cashflow
- —
- DSCR
- —
- Eligible?
- —
Personal DTI + credit; lowest rate.
DSCR
20% down · 8.5% · 30yr
- Down + closing
- —
- Monthly P&I
- —
- Monthly cashflow
- —
- DSCR
- —
- Eligible?
- —
No personal income docs; deal must DSCR.
Hard money
10% down · 12.0% · 12mo
- Down + closing
- —
- Monthly P&I
- —
- Monthly cashflow
- —
- DSCR
- —
- Eligible?
- —
Short-term bridge; refi at stabilization.
Rent comps 2 comps
| Address | Beds | Baths | Sqft | Rent | $/sqft | DOM | Units | Dist |
|---|---|---|---|---|---|---|---|---|
| 7819 203rd St SW Edmonds, WA | 5.0 | 2.0 | 2312 | $3,300 | $1.43 | 44d | 1 | 0.78mi |
| 5608 218th Ct SW Mountlake Terrace, WA | 4.0 | 2.5 | 2857 | $4,695 | $1.64 | 44d | 1 | 1.09mi |
Listing history 6 events
-
2026-04-19status Pending
-
2026-04-15$549,000 Active
-
2005-02-08soldstatus $270,000
-
2005-02-08soldstatus $270,000
-
2005-01-05$269,950
-
1999-04-26soldstatus $172,500
ⓘ Source: listings_history table (triggers on properties + properties_extension) + one-shot
backfill from property_details.listing_events for pre-trigger history.
Tax reassessment forecast WA · Resets to sale price
- Current annual tax
- $5,824 · $485/mo
- Projected year-2 tax
- $5,824 · $485/mo
- Expected delta
- $0/yr ($0/mo · 0.0%)
ⓘ Screening estimate from a state-policy table — verify with the county assessor before closing.
Climate risk First Street
- Flood 1/10 Low FEMA zone X (unshaded) · 0% chance over 30 yrs
- Wildfire 1/10 Low
- Heat 3/10 Moderate 7 d/yr ≥86°F today · 15 d/yr by 30 yrs out
- Wind 1/10 Low
- Air quality 6/10 Major 9 unhealthy d/yr today · 10 by 30 yrs out
Nearby sold comps map
Loading sold comps map…
Walkable amenities ~0.75 mi
Loading nearby amenities…
Taxation est. · year 1
- Rental income
- $52,884
- − Mortgage interest
- −$30,753
- − Property taxes
- −$5,824
- − Insurance
- −$2,745
- − Repairs & maintenance
- −$4,231
- − Management
- −$4,231
- − Depreciation
- −$15,971
- Taxable loss
- −$10,870
- Est. tax savings @ 24.0%
- +$2,609
- After-tax cash flow
- $1,270/yr
For passive investors: Depreciation is non-cash, so a rental often shows a tax loss while cash-flowing — sheltering income. Rental losses are passive: they offset passive income freely, and up to $25,000/yr can offset ordinary (W-2) income if you actively participate and your MAGI is under $100k (phasing out to $0 by $150k); unused losses carry forward. On sale, claimed depreciation is recaptured at up to 25%, and gains may owe capital-gains tax (a 1031 exchange can defer both). Figures are a year-1 estimate at your 24.0% rate — not tax advice; consult a CPA.
Schools (NCES district)
- District
- Edmonds School District
- NCES district ID
- 5302400
- Math proficiency
- 54% ▼ -1.00%
- Reading proficiency
- 65% ▬ 0.00%
- Median HH income
- $67,451
- Composite
- 53.94/100
- National rank
- #3026
- State rank
- #53 of 291 in WA
Livability — Lynnwood
- Score
- 77/100
- State rank
- #150
- US rank
- #3226
Category grades
Schools grade is shown separately in the Schools card above.
Census & demographics
- Census place
- Lynnwood, WA
- County
- Snohomish County · 786,756 people
- City population
- 152,865
- Metro
- Seattle-Tacoma-Bellevue, WA
- Population (ZIP)
- 42,370
- Household income
- $88,958
- Rent vs Own
- Severe rent burden
- 1781.0
Population outlook (Snohomish County) Hauer SSP2
- Today (2025)
- 899,800 people
- By 2030
- 960,975 · +6.8%
- By 2040
- 1,074,447 · +19.4%
- By 2050
- 1,171,954 · +30.2%
- By 2075
- 1,384,849 · +53.9%
- By 2100
- 1,497,296 · +66.4%
Race, ethnicity, and origin ACS 2023
- Neighborhood character
- Diverse neighborhood (Simpson 0.63)
- Race & ethnicity
- White 56% Asian 18% Hispanic / Latino 11% Two or more races 9% Black 9%
- Hispanic origin (detail)
- Mexican 8%
- Common ancestry
- Portuguese 5% Italian 4% Lithuanian 2%
- Foreign-born
- 27% · Canada, Vietnam, China
- Languages at home
- 65% English-only · Spanish 8% Other Indo-European 4% Other Asian/Pacific 4%
Political lean MEDSL · Snohomish
- 2024 margin
- D (+19.0) · D 57.8% · R 38.9% · Other 3.3%
- 2008→2024 swing
- +0.1pp no change · 2008: 18.9pp · 2024: 19.0pp
- All cycles
- 2024: D+19.0 2020: D+20.6 2016: D+16.6 2012: D+16.2 2008: D+18.9
Not yet ingested
- Civics
- —
Market trends
- HPI YoY
- ▼ -914.47%
- Current HPI
- 354.9913
- Rent YoY
- ▲ 2.25%
- Metro
- Seattle-Tacoma-Bellevue, WA
- State GDP YoY
- ▲ 4.65%
- F500 in state
- 22
Industry mix (Fortune 500 HQ in WA)
| Industry | F500 HQs | Revenue |
|---|---|---|
| Retail | 2 | $269B |
|
||
| Technology / Retail | 1 | $638B |
|
||
| Technology | 1 | $245B |
|
||
| Telecommunications | 1 | $38B |
|
||
| Food / Beverage | 1 | $36B |
|
||
| Automotive / Trucks | 1 | $34B |
|
||
Price history
+218.3% since first listed6 events — show timeline
- 2026-04-19 Pending — NWMLS as Distributed by MLS Grid
- 2026-04-15 Listed $549,000 NWMLS as Distributed by MLS Grid
- 2005-02-08 Sold (Public Records) $270,000 Public Records
- 2005-02-08 Sold (MLS) $270,000 NWMLS as Distributed by MLS Grid
- 2005-01-05 Listed $269,950 NWMLS as Distributed by MLS Grid
- 1999-04-26 Sold (Public Records) $172,500 Public Records
Property tax history
+4.1%/yrLatest (2026): $5,824 · +24.0% YoY. Source: county tax records.
Cash-flow waterfall
monthlySold comps — $/sqft
last 12 mo · ≤1 miLoading sold comps…