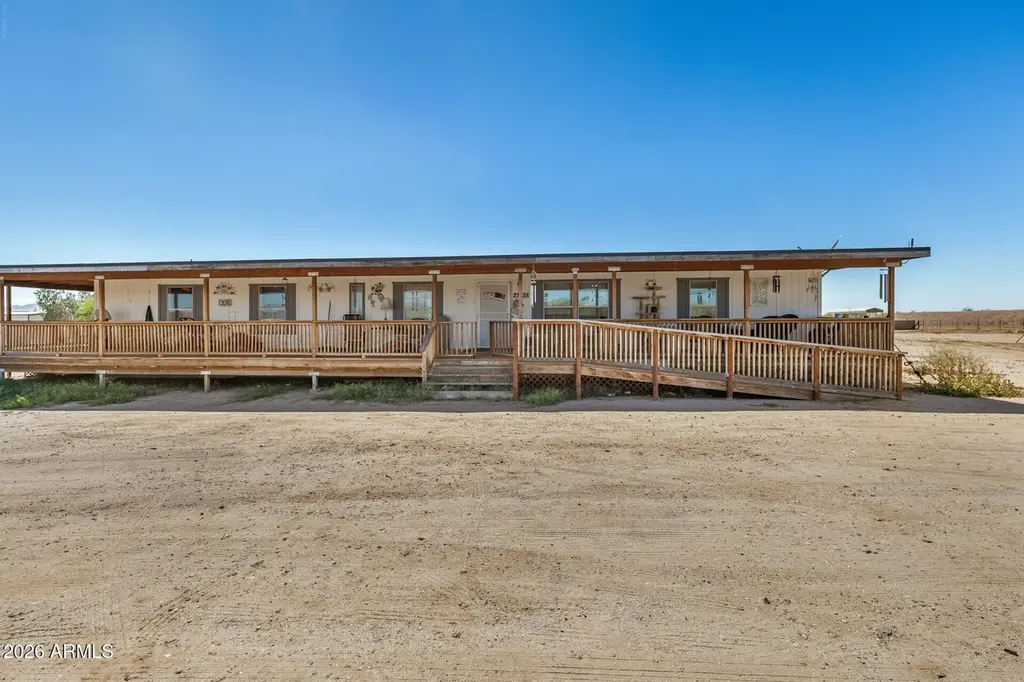
27828 N Black Butte Rd
Surprise, AZ 85361
$330,000D+
4 bd · 3.0 ba ·
2,016 sqft ·
Built 2001
· Manufactured
· Active
· 78 DOM
Cashflow @ list (25.0% down · 7.5%)
Estimated rent
$2,250/mo
Mortgage (P&I)
−$1,731
Tax + insurance
−$210
HOA
−$0
Vac / Maint / Mgmt
−$472
Net cashflow
$-163/mo
Annual
$-1,958/yr
Cap rate
5.70%
Cash-on-cash
-2.12%
DSCR
0.91
1% rule
0.68%
Cash to close
$92,400
Investor read
- This is a 4-bed/3.0-bath manufactured listed at $330k.
- At list price, monthly cash flow is $-163 ($-2k/yr) — negative.
- To cash-flow at today's rent, offer at most $301k (8.7% below list).
- To meet the 1% rule (rent ≥ 1% of price), the offer needs to be $225k (31.8% below list).
- It's been on market 78 days — a 6% lower offer ($310k) is reasonable based on typical stale-listing flexibility.
- Recommended offer: $225k (31.8% below list) — sets the bar for 1% rule.
- In year one you build about $35k of equity ($2k loan paydown + $33k appreciation (10.0% local appreciation)).
- Location reads 74/100 on livability (#19 in AZ, #4,616 nationally) — a middle-class / working-renter tenant base. Strengths: crime A+, housing A+, employment A-; Watch: health & safety D+, amenities D-, commute F.
- Nadaburg Unified School District (4252) (rural): math 30% / reading 37% proficiency, ranked #90 of 249 in AZ (top 36%) — families likely to look elsewhere, expect single-tenant / working-renter base with shorter leases.
- Market conditions: 373 active listings in the ZIP; 1 comparable units currently listed for rent nearby; 36,011 units permitted in Maricopa County in 2024 (12,801 in 5+ unit buildings).
- Maricopa County population projected at +38% by 2050 — long-run rental-demand tailwind backs the buy-and-hold thesis.
- 6 sale attempts since 20y ago with the ask held roughly flat each time — persistent listings suggest the price (not the market) is what's stuck; bring a comps-based counter.
- Current owner paid $180k; list at $330k implies a 83% gain — meaningful room to come down on a strong offer.
- By year 2, paydown + projected appreciation supports a ~$57k cash-out refi (75% LTV) — recoverable capital for the next deal without selling this one.
- Climate carrying-cost: major wildfire risk; extreme-heat days projected 7→17/yr by 2055 (HVAC capex compounding) — expect insurance premiums to compound above CPI over the hold.
- Cap rate 5.7% vs local median 3.3% in Surprise — top-decile yield for the area; either an underpriced asset or a hidden risk that comps aren't pricing in. Stress-test before assuming the spread holds.
Questions for listing agent
- What do current leases actually rent for vs. the listed asking? Can we see a recent rent roll and the last 12 months of T-12 income?
- It's been on market 78 days. Have you received any prior offers? Is the seller open to a 32% concession, seller financing, or rate buy-down credit?
- Why hasn't it sold? Are there any deal-killer items the seller is aware of (foundation, flood, title, zoning, code violations)?
- Is there a deadline driving the sale (1031 exchange, divorce, estate, relocation)? That informs how much negotiation room exists.
- The area grade is low — what's the realistic commute time and amenity access for the typical tenant pool here? Any planned neighborhood developments (good or bad) we should know about?
- What's the average days-on-market for RENTAL listings here right now (not sales)? A rising rental-DOM trend means longer vacancies and softer asking-rent achievability than the comps imply.
- What's the recent tenant-quality profile in this submarket — average credit score on applications, eviction rate, late-payment / NSF rate, and stable-employment percentage? A property-management company in the area should have these aggregated.
- How much new for-sale + rental construction is in the pipeline within 1–3 miles? Heavy new supply typically softens prices + rents 12–24 months out; constrained supply supports both.
CashFlowRE · CFR-7NTWDT24FZ0TAR
· Data 2 days ago
cashflowre.app · 2026-05-29