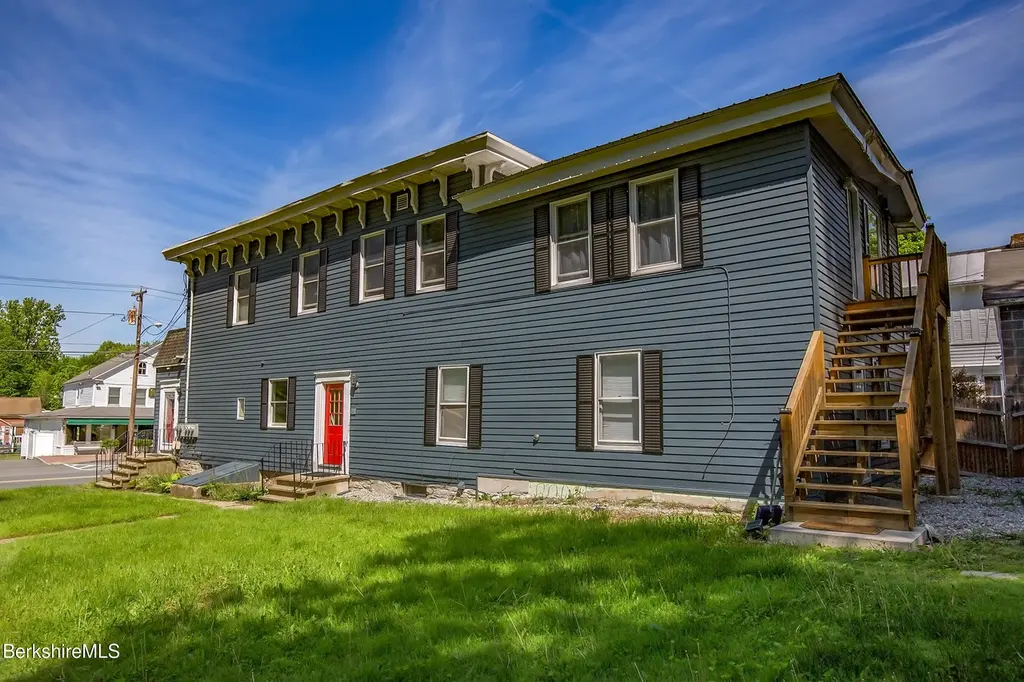
35 Main St
West Stockbridge, MA 01266
$750,000B-
7 bd · 4.0 ba ·
3,192 sqft ·
Built 1920
· MultiFamily
· Active
· 38 DOM
Cashflow @ list (25.0% down · 7.5%)
Estimated rent
$10,234/mo
Mortgage (P&I)
−$3,933
Tax + insurance
−$862
HOA
−$0
Vac / Maint / Mgmt
−$2,149
Net cashflow
$3,289/mo
Annual
$39,472/yr
Cap rate
11.64%
Cash-on-cash
19.11%
DSCR
1.85
1% rule
1.36%
Cash to close
$210,000
Investor read
- This is a 4 × 2-bed/1.0-bath units multifamily listed at $750k.
- At list price, monthly cash flow is $3k ($39k/yr) — positive. Per door: $822/mo.
- The deal already cash-flows at list — no discount required.
- Meets the 1% rule at list price ($10k rent vs $750k).
- It's been on market 38 days — a 3% lower offer ($728k) is reasonable based on typical stale-listing flexibility.
- Recommended offer: $728k (3.0% below list) — sets the bar for market timing.
- In year one you build about $25k of equity ($5k loan paydown + $20k appreciation (2.7% local appreciation)).
- Location reads: area grade B — affects rentability + tenant quality, not the cash-flow math above.
- Berkshire Hills (rural): math 33% / reading 49% proficiency, ranked #197 of 302 in MA (top 65%) — families likely to look elsewhere, expect single-tenant / working-renter base with shorter leases.
- Zoned schools: Muddy Brook Regional Elementary School (math 47% / reading 52%, grade D, #330 of 938 statewide, top 38%, 372 students, 0% FRL); W.E.B. Du Bois Regional Middle School (math 22% / reading 40%, grade F, #203 of 305 statewide, top 67%, 325 students, 0% FRL); Monument Mt Regional High (math 57% / reading 77%, grade B, #97 of 343 statewide, top 30%, 472 students, 0% FRL) — zoned schools average 0% FRL vs 21% district-wide (21 pts lower); this property's tenant base skews higher-income than the district average.
- Watch-outs: flood insurance adds $56/mo; built in 1920 — expect roof / HVAC / electrical / plumbing capex.
- Market conditions: 31 active listings in the ZIP; 130 units permitted in Berkshire County in 2024 (10 in 5+ unit buildings).
- Berkshire County population projected at -24% by 2050 — secular population decline; favor cash flow + early exit over multi-decade hold.
- 7 sale attempts since 25y ago with the ask held roughly flat each time — persistent listings suggest the price (not the market) is what's stuck; bring a comps-based counter.
- Current owner paid $415k; list at $750k implies a 81% gain — meaningful room to come down on a strong offer.
- At projected returns (2.7% appreciation + 3.0% rent growth), your $210k cash investment doubles in ~4 years — after that, you're playing with house money.
- By year 3, paydown + projected appreciation supports a ~$64k cash-out refi (75% LTV) — recoverable capital for the next deal without selling this one.
- Climate carrying-cost: severe flood risk — expect insurance premiums to compound above CPI over the hold.
Questions for listing agent
- It's been on market 38 days. Have you received any prior offers? Is the seller open to a 3% concession, seller financing, or rate buy-down credit?
- Can we see the unit-by-unit rent roll, current vacancy, and any below-market leases? What's the average tenancy length?
- What capital expenditures (roof, boiler, parking lot, exteriors) have been made in the last 5 years, and what's planned in the next 2?
- Built in 1920 — when were the roof, HVAC, electrical panel, plumbing, and water heater last replaced?
- What's the actual annual flood-insurance premium (NFIP or private), and is the property in a SFHA with mandatory coverage?
- Is there a deadline driving the sale (1031 exchange, divorce, estate, relocation)? That informs how much negotiation room exists.
- What's the average days-on-market for RENTAL listings here right now (not sales)? A rising rental-DOM trend means longer vacancies and softer asking-rent achievability than the comps imply.
- What's the recent tenant-quality profile in this submarket — average credit score on applications, eviction rate, late-payment / NSF rate, and stable-employment percentage? A property-management company in the area should have these aggregated.
CashFlowRE · CFR-7P8YE999MZ81T0
· Data 14 h ago
cashflowre.app · 2026-05-29