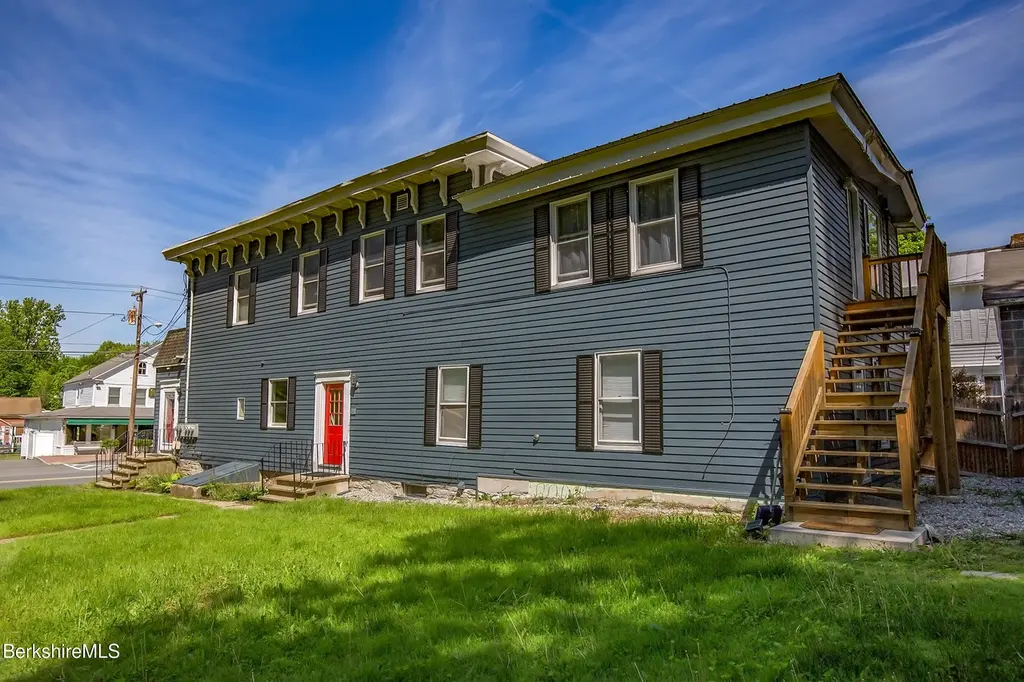
 Fourplex
35 Main St · West Stockbridge, MA
Flood risk 8/10 · Major
- FEMA flood zone
- X
- Chance of flooding over 30 yrs
- 0.99%
- Est. flood insurance / yr
- $473 – $860
Fire risk 3/10 · Minor
- Est. fire insurance / yr
- $915 – $1,699
Heat risk 3/10 · Minor
- Hot days now (above 92°F)
- 7 days/yr
- Hot days in 30 yrs
- 17 days/yr
Wind risk 4/10 · Minor
- Chance of severe wind over 30 yrs
- 11.0%
Air-quality risk 2/10 · Minimal
- Unhealthy air days now
- 1 days/yr
- Unhealthy air days in 30 yrs
- 1 days/yr
Risk factors via First Street. Map © Google.
Why this score? — see what drove the B- grade
The composite is a weighted blend of 9 inputs, each scored 0–100. Each bar is that input's sub-score; the figure is the points it added to the 100-point composite (weight × sub-score).
- Cash flow +30.0/30.0
- DSCR +10.0/10.0
- 1% rule +8.6/10.0
- Appreciation +6.4/10.0
- Schools +3.6/10.0
- Rent growth +2.5/5.0
- Livability +2.5/5.0
- Condition / age +2.5/5.0
- ARV discount +0.0/15.0
$750,000
🖨 Deal sheet (PDF) 📄 Offer letter ✓ Due diligence
Multi-family units
County records classify this as Multi-Family (5+ Unit). Listing-text estimate: 4 units. estimate disagrees with records
5+ unit building — per-unit beds/baths from public records are typically unavailable; the breakdown below (if shown) is an estimate from the listing text.
Listing remarks MLS
This four family is a great investment in a perfect downtown West Stockbridge location. All four units consist of two bedrooms and two bathrooms and the tenants pay all of their own utilities. The cap rate for this building is 7.95%.
Key facts
- Separate utilities
- Fresh paint
- New roof
Tags
Property features AI
Finance
- Financial info: Taxes reported for 2026
Exterior
- Utilities: Individual electric meter; Public sewer
- Construction: Asphalt roof; Total building area 3192
Interior
- Bedrooms: One unit with 2 bedrooms
- Flooring: Laminate
- Bathrooms: Four full bathrooms; One unit with 1 bathroom
- Heating & cooling: Electric heating
- Interior features: Laminate flooring; Has heating; Electric heating
Neighborhood map
What this means for you Summary
Snapshot
- This is a 4 × 2-bed/1.0-bath units multifamily listed at $750k.
Deal economics
- At list price, monthly cash flow is $3k ($39k/yr) — positive. Per door: $822/mo.
- The deal already cash-flows at list — no discount required.
- Meets the 1% rule at list price ($10k rent vs $750k).
- Recommended offer: $728k (3.0% below list) — sets the bar for market timing.
Location & tenants
- Location reads: area grade B — affects rentability + tenant quality, not the cash-flow math above.
- Berkshire Hills (rural): math 33% / reading 49% proficiency, ranked #197 of 302 in MA (top 65%) — families likely to look elsewhere, expect single-tenant / working-renter base with shorter leases.
- Zoned schools: Muddy Brook Regional Elementary School (math 47% / reading 52%, grade D, #330 of 938 statewide, top 38%, 372 students, 0% FRL); W.E.B. Du Bois Regional Middle School (math 22% / reading 40%, grade F, #203 of 305 statewide, top 67%, 325 students, 0% FRL); Monument Mt Regional High (math 57% / reading 77%, grade B, #97 of 343 statewide, top 30%, 472 students, 0% FRL) — zoned schools average 0% FRL vs 21% district-wide (21 pts lower); this property's tenant base skews higher-income than the district average.
- Market conditions: 31 active listings in the ZIP; 130 units permitted in Berkshire County in 2024 (10 in 5+ unit buildings).
Forward outlook
- In year one you build about $25k of equity ($5k loan paydown + $20k appreciation (2.7% local appreciation)).
- Berkshire County population projected at -24% by 2050 — secular population decline; favor cash flow + early exit over multi-decade hold.
- At projected returns (2.7% appreciation + 3.0% rent growth), your $210k cash investment doubles in ~4 years — after that, you're playing with house money.
- By year 3, paydown + projected appreciation supports a ~$64k cash-out refi (75% LTV) — recoverable capital for the next deal without selling this one.
Negotiation context
- It's been on market 38 days — a 3% lower offer ($728k) is reasonable based on typical stale-listing flexibility.
- 7 sale attempts since 25y ago with the ask held roughly flat each time — persistent listings suggest the price (not the market) is what's stuck; bring a comps-based counter.
- Current owner paid $415k; list at $750k implies a 81% gain — meaningful room to come down on a strong offer.
Risks & watch-outs
- Watch-outs: flood insurance adds $56/mo; built in 1920 — expect roof / HVAC / electrical / plumbing capex.
- Climate carrying-cost: severe flood risk — expect insurance premiums to compound above CPI over the hold.
Questions for the listing agent
- It's been on market 38 days. Have you received any prior offers? Is the seller open to a 3% concession, seller financing, or rate buy-down credit?
- Can we see the unit-by-unit rent roll, current vacancy, and any below-market leases? What's the average tenancy length?
- What capital expenditures (roof, boiler, parking lot, exteriors) have been made in the last 5 years, and what's planned in the next 2?
- Built in 1920 — when were the roof, HVAC, electrical panel, plumbing, and water heater last replaced?
- What's the actual annual flood-insurance premium (NFIP or private), and is the property in a SFHA with mandatory coverage?
- Is there a deadline driving the sale (1031 exchange, divorce, estate, relocation)? That informs how much negotiation room exists.
- What's the average days-on-market for RENTAL listings here right now (not sales)? A rising rental-DOM trend means longer vacancies and softer asking-rent achievability than the comps imply.
- What's the recent tenant-quality profile in this submarket — average credit score on applications, eviction rate, late-payment / NSF rate, and stable-employment percentage? A property-management company in the area should have these aggregated.
- How much new apartment / multifamily construction is in the pipeline within 1–3 miles? Heavy new supply (>2% of stock underway) typically softens rents 12–24 months out; light construction supports rent growth.
Investment metrics
- 1% rule
- 1.36% ✓
- Cap rate
- 11.64%
- Cash-on-cash
- 19.11%
- DSCR
- 1.85
- GRM
- 6.1
CMA / ARV
- ARV (median comp)
- $512,372
- List price
- $750,000
- Delta
- 46.38%
- Verdict
- OVERPRICED
- Comps
- 1 within 2.0 mi
Projected returns pro-forma
2.71% appreciation · 3.0% rent growth · sell at horizon
- IRR
- 24.6%
- Equity multiple
- 2.37×
- Total profit
- $288,213
- Equity at exit
- $324,944
- IRR
- 25.6%
- Equity multiple
- 4.56×
- Total profit
- $746,935
- Equity at exit
- $491,426
Cash invested: $210,000 (down + closing). Projections, not guarantees.
Landlord ↔ Tenant lean methodology
- Overall (STATE)
- 20 Strongly Tenant-Friendly
- State Massachusetts
- 20 Strongly Tenant-Friendly · D+15
- County
- — inherits STATE
- City
- — inherits STATE
ZIP-level market 01266
- Home prices YoY
- 0.8%
- Active inventory
- 31
- Price-to-rent
- 24.4×
Monthly cashflow live
- Estimated rent
- $10,234 medium interval (Pro) →
- Mortgage (P&I)
- −$3,933
- Tax from tax record
- −$494 /mo · $5,933/yr
- Insurance
- −$312
- Flood insurance flood zone
- −$56 /mo · $666/yr
- HOA
- −$0
- Vacancy / Maint / Mgmt
- −$2,149
- Net cashflow
- $3,289
Break-even live
Sensitivity live
| Price | -10% $3,714 | -5% $3,502 | +0% $3,289 | +5% $3,077 | +10% $2,865 |
|---|---|---|---|---|---|
| Rent | -10% $2,481 | -5% $2,885 | +0% $3,289 | +5% $3,694 | +10% $4,098 |
| Rate | -1.0pp $3,667 | -0.5pp $3,480 | base $3,289 | +0.5pp $3,095 | +1.0pp $2,897 |
4-unit breakdown (identical units grouped — click to expand)
| Units | Beds | Baths | Est. rent |
|---|---|---|---|
| 4× units | 2 | 1 | $10,236 |
| #1 | 2 | 1 | $2,559 |
| #2 | 2 | 1 | $2,559 |
| #3 | 2 | 1 | $2,559 |
| #4 | 2 | 1 | $2,559 |
| Total (4 units) | $10,234 | ||
UW: 25.0% down · 7.5% · 30yr · 1.5% tax · 5.0% vac · 8.0% maint · 8.0% mgmt
Financing live
Cash to close
- Down payment
- $187,500
- Closing costs
- $22,500
- Reserves months
- —
- Total cash needed
- —
Loan-product check · same deal, 3 products live
Conventional
25% down · 7.5% · 30yr
- Down + closing
- —
- Monthly P&I
- —
- Monthly cashflow
- —
- DSCR
- —
- Eligible?
- —
Personal DTI + credit; lowest rate.
DSCR
20% down · 8.5% · 30yr
- Down + closing
- —
- Monthly P&I
- —
- Monthly cashflow
- —
- DSCR
- —
- Eligible?
- —
No personal income docs; deal must DSCR.
Hard money
10% down · 12.0% · 12mo
- Down + closing
- —
- Monthly P&I
- —
- Monthly cashflow
- —
- DSCR
- —
- Eligible?
- —
Short-term bridge; refi at stabilization.
Listing history 33 events
-
2026-06-21days on market $750,000 Active 38 DOM
-
2026-06-21days on market $750,000 Active 37 DOM
-
2026-06-18days on market $750,000 Active 35 DOM
-
2026-06-17days on market $750,000 Active 34 DOM
-
2026-06-16days on market $750,000 Active 33 DOM
-
2026-06-15days on market $750,000 Active 32 DOM
-
2026-06-13days on market $750,000 Active 30 DOM
-
2026-06-12days on market $750,000 Active 29 DOM
-
2026-06-09days on market $750,000 Active 26 DOM
-
2026-06-08days on market $750,000 Active 25 DOM
-
2026-06-07days on market $750,000 Active 24 DOM
-
2026-06-07days on market $750,000 Active 23 DOM
-
2026-06-04days on market $750,000 Active 20 DOM
-
2026-06-02days on market $750,000 Active 19 DOM
-
2026-06-01days on market $750,000 Active 18 DOM
-
2026-05-31days on market $750,000 Active 17 DOM
-
2026-05-31days on market $750,000 Active 16 DOM
-
2026-05-14$750,000 Active 321-char remark
-
2025-12-31historical
-
2025-06-07$775,000 Active
-
2022-11-23soldstatus $415,000 Closed
Show marketing remark (233 chars)
This four family is a great investment in a perfect downtown West Stockbridge location. All four units consist of two bedrooms and two bathrooms and the tenants pay all of their own utilities. The cap rate for this building is 7.95%.
-
2022-09-20status Pending
Show marketing remark (233 chars)
This four family is a great investment in a perfect downtown West Stockbridge location. All four units consist of two bedrooms and two bathrooms and the tenants pay all of their own utilities. The cap rate for this building is 7.95%.
-
2022-06-06$550,000 Active
Show marketing remark (233 chars)
This four family is a great investment in a perfect downtown West Stockbridge location. All four units consist of two bedrooms and two bathrooms and the tenants pay all of their own utilities. The cap rate for this building is 7.95%.
-
2016-09-09soldstatus $364,500
-
2016-06-27$375,000
-
2006-04-26historical
-
2006-02-26historical
-
2005-08-26$449,000
-
2005-08-26$449,000
-
2002-01-31soldstatus $180,000
-
2002-01-31soldstatus $180,000
-
2001-05-31$185,000
-
1986-06-18soldstatus $160,000
ⓘ Source: listings_history table (triggers on properties + properties_extension) + one-shot
backfill from property_details.listing_events for pre-trigger history.
Tax reassessment forecast MA · Partial reset (capped growth)
- Current annual tax
- $5,933 · $494/mo
- Projected year-2 tax
- $7,579 · $632/mo
- Expected delta
- +$1,646/yr (+$137/mo · 27.7%)
ⓘ Screening estimate from a state-policy table — verify with the county assessor before closing.
Climate risk First Street
- Flood 8/10 Severe FEMA zone X · 99% chance over 30 yrs
- Wildfire 3/10 Moderate
- Heat 3/10 Moderate 7 d/yr ≥92°F today · 17 d/yr by 30 yrs out
- Wind 4/10 Moderate 11% chance of damaging wind over 30 yrs
- Air quality 2/10 Low 1 unhealthy d/yr today · 1 by 30 yrs out
Nearby sold comps map
Loading sold comps map…
Walkable amenities ~0.75 mi
Loading nearby amenities…
Taxation est. · year 1
- Rental income
- $122,808
- − Mortgage interest
- −$42,012
- − Property taxes
- −$5,933
- − Insurance
- −$4,416
- − Repairs & maintenance
- −$9,825
- − Management
- −$9,825
- − Depreciation
- −$21,818
- Taxable income
- $28,979
- Est. tax owed @ 24.0%
- −$6,955
- After-tax cash flow
- $32,517/yr
For passive investors: Depreciation is non-cash, so a rental often shows a tax loss while cash-flowing — sheltering income. Rental losses are passive: they offset passive income freely, and up to $25,000/yr can offset ordinary (W-2) income if you actively participate and your MAGI is under $100k (phasing out to $0 by $150k); unused losses carry forward. On sale, claimed depreciation is recaptured at up to 25%, and gains may owe capital-gains tax (a 1031 exchange can defer both). Figures are a year-1 estimate at your 24.0% rate — not tax advice; consult a CPA.
Schools (NCES district)
- District
- Berkshire Hills
- NCES district ID
- 2502530
- Math proficiency
- 33% ▼ -14.00%
- Reading proficiency
- 49% ▼ -5.00%
- Median HH income
- $54,413
- Composite
- 35.69/100
- National rank
- #4868
- State rank
- #197 of 302 in MA
Livability — West Stockbridge
No livability data for this city. (Only ~50 U.S. cities are tracked.)
Census & demographics
- Population (ZIP)
- 919
Population outlook (Berkshire County) Hauer SSP2
- Today (2025)
- 119,723 people
- By 2030
- 114,608 · -4.3%
- By 2040
- 102,806 · -14.1%
- By 2050
- 91,305 · -23.7%
- By 2075
- 71,517 · -40.3%
- By 2100
- 57,988 · -51.6%
Race, ethnicity, and origin ACS 2023
- Neighborhood character
- Predominantly White (92%)
- Race & ethnicity
- White 92% Hispanic / Latino 4% Native American 2% Two or more races 2% Asian 1%
- Common ancestry
- Lithuanian 8% Scotch-Irish 4% Slovak 4%
- Foreign-born
- 8% · Canada, China
- Languages at home
- 90% English-only · Spanish 5% French/Haitian/Cajun 1% Other Indo-European 1%
Political lean MEDSL · Berkshire
- 2024 margin
- Solid D (+39.9) · D 68.9% · R 29.0% · Other 2.1%
- 2008→2024 swing
- -12.5pp toward R · 2008: 52.4pp · 2024: 39.9pp
- All cycles
- 2024: D+39.9 2020: D+47.1 2016: D+41.5 2012: D+53.7 2008: D+52.4
Not yet ingested
- Civics
- —
Market trends
- HPI YoY
- ▲ 2.71%
- Current HPI
- 324.1646
- Rent YoY
- —
- Metro
- —
- State GDP YoY
- ▲ 2.28%
- F500 in state
- 38
Industry mix (Fortune 500 HQ in MA)
| Industry | F500 HQs | Revenue |
|---|---|---|
| Technology | 3 | $17B |
|
||
| Insurance | 2 | $84B |
|
||
| Retail | 2 | $76B |
|
||
| Life Sciences | 1 | $43B |
|
||
| Energy Technology | 1 | $31B |
|
||
| Aerospace / Defense | 1 | $18B |
|
||
Price history
+368.8% since first listed16 events — show timeline
- 2026-05-14 Listed $750,000 BCMLS
- 2025-12-31 Listing Removed — BCMLS
- 2025-06-07 Listed $775,000 BCMLS
- 2022-11-23 Sold (MLS) $415,000 BCMLS
- 2022-09-20 Pending — BCMLS
- 2022-06-06 Listed $550,000 BCMLS
- 2016-09-09 Sold (MLS) $364,500 BCMLS
- 2016-06-27 Listed $375,000 BCMLS
- 2006-04-26 Listing Removed — BCMLS
- 2006-02-26 Listing Removed — BCMLS
- 2005-08-26 Listed $449,000 BCMLS
- 2005-08-26 Listed $449,000 BCMLS
- 2002-01-31 Sold (Public Records) $180,000 Public Records
- 2002-01-31 Sold (MLS) $180,000 BCMLS
- 2001-05-31 Listed $185,000 BCMLS
- 1986-06-18 Sold (Public Records) $160,000 Public Records
Property tax history
+6.1%/yrLatest (2023): $5,933 · +13.8% YoY. Source: county tax records.
Cash-flow waterfall
monthlySold comps — $/sqft
last 12 mo · ≤1 miLoading sold comps…