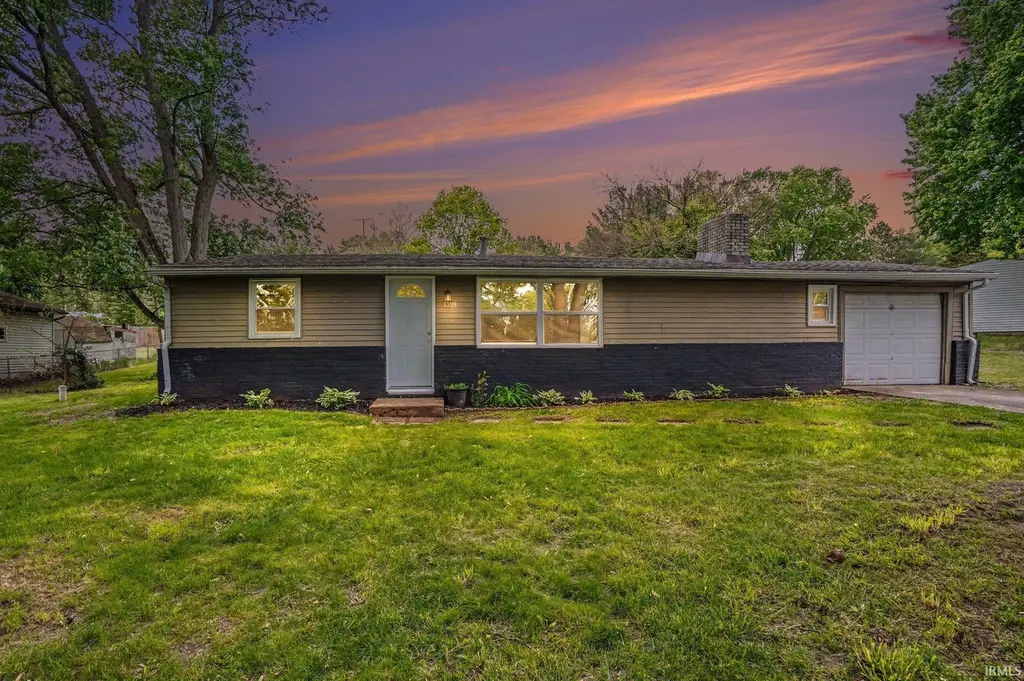
53219 Peggy Ave
Granger, IN 46635
$154,900C+
2 bd · 1.0 ba ·
1,000 sqft ·
Built 1954
· SingleFamily
· Active
· 35 DOM
Cashflow @ list (25.0% down · 7.5%)
Estimated rent
$1,649/mo
Mortgage (P&I)
−$812
Tax + insurance
−$147
HOA
−$0
Vac / Maint / Mgmt
−$346
Net cashflow
$343/mo
Annual
$4,113/yr
Cap rate
8.95%
Cash-on-cash
9.48%
DSCR
1.42
1% rule
1.06%
Cash to close
$43,372
Investor read
- This is a 2-bed/1.0-bath single-family listed at $155k.
- At list price, monthly cash flow is $343 ($4k/yr) — positive.
- The deal already cash-flows at list — no discount required.
- Meets the 1% rule at list price ($2k rent vs $155k).
- It's been on market 35 days — a 3% lower offer ($150k) is reasonable based on typical stale-listing flexibility.
- Recommended offer: $150k (3.0% below list) — sets the bar for market timing.
- Local home prices are declining (-3.0%/yr); year-one equity from $1k of loan paydown is wiped out by about $5k of value loss. Plan a longer hold.
- Location reads 78/100 on livability (#33 in IN, #2,584 nationally) — a middle-class / working-renter tenant base. Strengths: crime A+, employment A+, cost of living A+; Watch: amenities F, commute F.
- South Bend Community School Corporation (urban): math 12% / reading 21% proficiency, ranked #284 of 301 in IN (top 94%) — low school quality limits family demand, transient renter base, plan for 1-2y turnover; 66% free/reduced lunch — lower-income household profile, screen leases tightly.
- Zoned schools: Jefferson Traditional School (math 12% / reading 22%, grade F, #284 of 330 statewide, top 87%, 516 students, 64% FRL); Adams High School (math 28% / reading 57%, grade F, #195 of 369 statewide, top 53%, 1,976 students, 56% FRL).
- Zoned-school proficiency averages 30% at this address vs 16% district-wide (+13 pts) — the actual schools serving this property are materially stronger than the South Bend Community School Corporation average implies; a family-tenant draw the district grade alone would hide.
- Watch-outs: built in 1954 — expect roof / HVAC / electrical / plumbing capex.
- Market conditions: 32 active listings in the ZIP; 4 comparable units currently listed for rent nearby; rentals at typical pace (median 14d on market — plan ~3-4 weeks tenant-placement turnaround); 754 units permitted in St. Joseph County in 2024 (460 in 5+ unit buildings).
- Current owner paid $89k; list at $155k implies a 74% gain — meaningful room to come down on a strong offer.
- Cap rate 8.9% vs local median 3.3% in Granger — top-decile yield for the area; either an underpriced asset or a hidden risk that comps aren't pricing in. Stress-test before assuming the spread holds.
Questions for listing agent
- It's been on market 35 days. Have you received any prior offers? Is the seller open to a 3% concession, seller financing, or rate buy-down credit?
- Built in 1954 — when were the roof, HVAC, electrical panel, plumbing, and water heater last replaced?
- Is there a deadline driving the sale (1031 exchange, divorce, estate, relocation)? That informs how much negotiation room exists.
- Schools are A-rated — typically a magnet for longer-tenancy family renters. What's the average tenant stay here, and is there a school-zone premium baked into asking?
- What's the average days-on-market for RENTAL listings here right now (not sales)? A rising rental-DOM trend means longer vacancies and softer asking-rent achievability than the comps imply.
- What's the recent tenant-quality profile in this submarket — average credit score on applications, eviction rate, late-payment / NSF rate, and stable-employment percentage? A property-management company in the area should have these aggregated.
- How much new for-sale + rental construction is in the pipeline within 1–3 miles? Heavy new supply typically softens prices + rents 12–24 months out; constrained supply supports both.
CashFlowRE · CFR-7R90CKD6XYJ2FZ
· Data 1 day ago
cashflowre.app · 2026-05-29