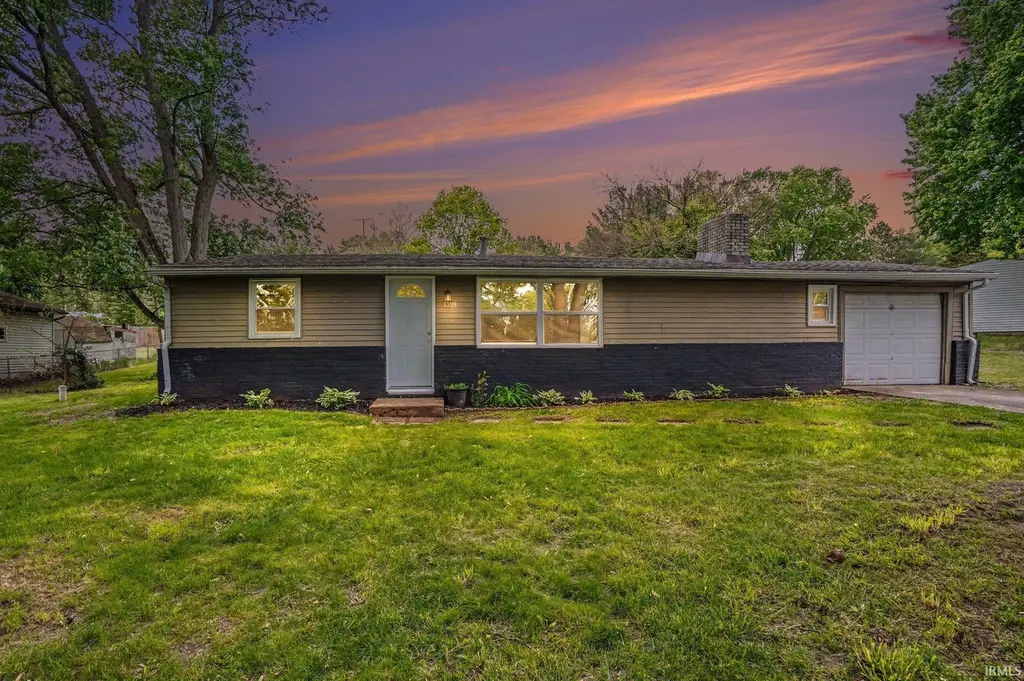
53219 Peggy Ave · Granger, IN
Flood risk 3/10 · Minor
- FEMA flood zone
- X (unshaded)
- Chance of flooding over 30 yrs
- 0.2%
- Est. flood insurance / yr
- $507 – $1,088
Fire risk 1/10 · Minimal
- Est. fire insurance / yr
- $717 – $1,331
Heat risk 2/10 · Minimal
- Hot days now (above 99°F)
- 7 days/yr
- Hot days in 30 yrs
- 16 days/yr
Wind risk 2/10 · Minimal
- Chance of severe wind over 30 yrs
- —
Air-quality risk 3/10 · Minor
- Unhealthy air days now
- 2 days/yr
- Unhealthy air days in 30 yrs
- 3 days/yr
Risk factors via First Street. Map © Google.
Why this score? — see what drove the C+ grade
The composite is a weighted blend of 9 inputs, each scored 0–100. Each bar is that input's sub-score; the figure is the points it added to the 100-point composite (weight × sub-score).
- Cash flow +25.1/30.0
- ARV discount +15.0/15.0
- DSCR +8.2/10.0
- 1% rule +5.6/10.0
- Livability +3.9/5.0
- Rent growth +2.5/5.0
- Condition / age +2.5/5.0
- Schools +1.4/10.0
- Appreciation +0.0/10.0
$154,900
🖨 Deal sheet 📄 Offer letter ✓ Due diligence
Listing remarks
Don't miss seeing this nicely updated home in Clay Township with large 1/2 acre lot. There's plenty of living space in the 2 bed / 1 bath home. Featured is large living room with fireplace and an extra large dining space with patio door to the back yard. There's an additional room near the kitchen perfect for office or additional living space. You'll appreciate conveniences such as attached one car garage, concrete patio and small garden/storage shed. The home has new septic, new well, new LVP flooring, a fresh coat of paint throughout and newer roof. Located very close to Grape Road shopping and dining. Schedule a showing today!
Key facts
- New septic
- Large 1/2 acre lot
- Large living room
Tags
Property features AI
Exterior
- Parking: Attached garage with concrete parking (1 car)
- Utilities: Private well water; Septic tank sewer
- Home design: Single-family residence, site-built; Single story
- Construction: Brick and vinyl siding exterior; Slab foundation; Approximately 1,000 above-grade finished area
- Exterior features: Partial chain link fencing; Level lot
Interior
- Kitchen: Refrigerator; Gas range
- Flooring: Laminate flooring; Tile flooring
- Bathrooms: 1 full bathroom (main level)
- Heating & cooling: Forced air and natural gas heating; Wood stove heating; No cooling
- Interior features: Wood burning stove fireplace (1); 7 total rooms
- Laundry & utility: Washer and dryer included; Electric dryer hookup on the main level
Neighborhood map
What this means for you Summary
Snapshot
- This is a 2-bed/1.0-bath single-family listed at $155k.
Deal economics
- At list price, monthly cash flow is $343 ($4k/yr) — positive.
- The deal already cash-flows at list — no discount required.
- Meets the 1% rule at list price ($2k rent vs $155k).
- Recommended offer: $150k (3.0% below list) — sets the bar for market timing.
- Cap rate 8.9% vs local median 3.3% in Granger — top-decile yield for the area; either an underpriced asset or a hidden risk that comps aren't pricing in. Stress-test before assuming the spread holds.
Location & tenants
- Location reads 78/100 on livability (#33 in IN, #2,584 nationally) — a middle-class / working-renter tenant base. Strengths: crime A+, employment A+, cost of living A+; Watch: amenities F, commute F.
- South Bend Community School Corporation (urban): math 12% / reading 21% proficiency, ranked #284 of 301 in IN (top 94%) — low school quality limits family demand, transient renter base, plan for 1-2y turnover; 66% free/reduced lunch — lower-income household profile, screen leases tightly.
- Zoned schools: Jefferson Traditional School (math 12% / reading 22%, grade F, #284 of 330 statewide, top 87%, 516 students, 64% FRL); Adams High School (math 28% / reading 57%, grade F, #195 of 369 statewide, top 53%, 1,976 students, 56% FRL).
- Zoned-school proficiency averages 30% at this address vs 16% district-wide (+13 pts) — the actual schools serving this property are materially stronger than the South Bend Community School Corporation average implies; a family-tenant draw the district grade alone would hide.
- Market conditions: 32 active listings in the ZIP; 4 comparable units currently listed for rent nearby; rentals leasing fast (median 14d on market — plan ~1-2 weeks tenant-placement turnaround); 754 units permitted in St. Joseph County in 2024 (460 in 5+ unit buildings).
Forward outlook
- Local home prices are declining (-3.0%/yr); year-one equity from $1k of loan paydown is wiped out by about $5k of value loss. Plan a longer hold.
Negotiation context
- It's been on market 35 days — a 3% lower offer ($150k) is reasonable based on typical stale-listing flexibility.
- Current owner paid $89k; list at $155k implies a 74% gain — meaningful room to come down on a strong offer.
Risks & watch-outs
- Watch-outs: built in 1954 — expect roof / HVAC / electrical / plumbing capex.
Questions for the listing agent
- It's been on market 35 days. Have you received any prior offers? Is the seller open to a 3% concession, seller financing, or rate buy-down credit?
- Built in 1954 — when were the roof, HVAC, electrical panel, plumbing, and water heater last replaced?
- Is there a deadline driving the sale (1031 exchange, divorce, estate, relocation)? That informs how much negotiation room exists.
- Schools are A-rated — typically a magnet for longer-tenancy family renters. What's the average tenant stay here, and is there a school-zone premium baked into asking?
- What's the average days-on-market for RENTAL listings here right now (not sales)? A rising rental-DOM trend means longer vacancies and softer asking-rent achievability than the comps imply.
- What's the recent tenant-quality profile in this submarket — average credit score on applications, eviction rate, late-payment / NSF rate, and stable-employment percentage? A property-management company in the area should have these aggregated.
- How much new for-sale + rental construction is in the pipeline within 1–3 miles? Heavy new supply typically softens prices + rents 12–24 months out; constrained supply supports both.
Investment metrics
- 1% rule
- 1.06% ✓
- Cap rate
- 8.95%
- Cash-on-cash
- 9.48%
- DSCR
- 1.42
- GRM
- 7.8
CMA / ARV
- ARV (median comp)
- $190,136
- List price
- $154,900
- Delta
- -18.53%
- Verdict
- UNDERPRICED
- Comps
- 8 within 1.0 mi
Show comp detail 1 sale within ~0.75 mi
| Address | Dist | Beds/Ba | Sqft | Sold | Price | $/sf | Match |
|---|---|---|---|---|---|---|---|
| 17097 Ruthie Ave | 0.09mi | 3/1.0 (+1) | 1,000 (0%) | 22mo | $179,900 | $180 | 73 |
Match score weights: distance 35% · size 25% · config 20% · recency 20%. Top-matched comps best support the ARV.
Projected returns pro-forma
-3.0% appreciation · 3.0% rent growth · sell at horizon
- IRR
- -2.0%
- Equity multiple
- 0.92×
- Total profit
- $-3,314
- Equity at exit
- $23,096
- IRR
- 7.6%
- Equity multiple
- 1.58×
- Total profit
- $25,048
- Equity at exit
- $13,393
Cash invested: $43,372 (down + closing). Projections, not guarantees.
Landlord ↔ Tenant lean methodology
- Overall (STATE)
- 90 Strongly Landlord-Friendly
- State Indiana
- 90 Strongly Landlord-Friendly · R+11
- County
- — inherits STATE
- City
- — inherits STATE
ZIP-level market 46635
- Home prices YoY
- -29.8%
- Active inventory
- 32
- Price-to-rent
- 7.8×
Monthly cashflow live
- Estimated rent
- $1,649 medium interval (Pro) →
- Mortgage (P&I)
- −$812
- Tax from tax record
- −$83 /mo · $994/yr
- Insurance
- −$65
- HOA
- −$0
- Vacancy / Maint / Mgmt
- −$346
- Net cashflow
- $343
Break-even live
UW: 25.0% down · 7.5% · 30yr · 1.5% tax · 5.0% vac · 8.0% maint · 8.0% mgmt
Financing live
Cash to close
- Down payment
- $38,725
- Closing costs
- $4,647
- Reserves months
- —
- Total cash needed
- —
Loan-product check · same deal, 3 products live
Conventional
25% down · 7.5% · 30yr
- Down + closing
- —
- Monthly P&I
- —
- Monthly cashflow
- —
- DSCR
- —
- Eligible?
- —
Personal DTI + credit; lowest rate.
DSCR
20% down · 8.5% · 30yr
- Down + closing
- —
- Monthly P&I
- —
- Monthly cashflow
- —
- DSCR
- —
- Eligible?
- —
No personal income docs; deal must DSCR.
Hard money
10% down · 12.0% · 12mo
- Down + closing
- —
- Monthly P&I
- —
- Monthly cashflow
- —
- DSCR
- —
- Eligible?
- —
Short-term bridge; refi at stabilization.
Rent comps 4 comps
| Address | Beds | Baths | Sqft | Rent | $/sqft | DOM | Units | Dist |
|---|---|---|---|---|---|---|---|---|
| 5640 Irish Way Mishawaka, IN | 3.0 | 2.0 | 1189 | $1,675 | $1.41 | 43d | 1 | 0.70mi |
| 5630 University Park Dr Mishawaka, IN | 1.0–3.0 | 1.0–1.5 | 950 | $1,610 | $1.69 | 13d | 17 | 0.85mi |
| 424 Spring Lake Blvd Granger, IN | 1.0–2.0 | 1.0–2.0 | 868 | $1,722 | $1.98 | 13d | 14 | 1.43mi |
| 5726 Seneca Dr Mishawaka, IN | 1.0–2.0 | 1.0–2.0 | 840 | $1,591 | $1.89 | 13d | 49 | 1.47mi |
Listing history 19 events
-
2026-06-19price $154,900 Active 35 DOM
-
2026-06-18days on market $159,900 Active 35 DOM
-
2026-06-17days on market $159,900 Active 34 DOM
-
2026-06-16days on market $159,900 Active 33 DOM
-
2026-06-15days on market $159,900 Active 32 DOM
-
2026-06-14days on market $159,900 Active 30 DOM
-
2026-06-13days on market $159,900 Active 29 DOM
-
2026-06-10pricedays on market $159,900 Active 27 DOM
-
2026-06-09days on market $165,000 Active 26 DOM
-
2026-06-08days on market $165,000 Active 25 DOM
-
2026-06-07days on market $165,000 Active 24 DOM
-
2026-06-03days on market $165,000 Active 20 DOM
-
2026-06-03price $165,000 Active 19 DOM
-
2026-06-02days on market $169,900 Active 19 DOM
-
2026-06-01days on market $169,900 Active 18 DOM
-
2026-05-31days on market $169,900 Active 17 DOM
-
2026-05-30days on market $169,900 Active 16 DOM
-
2026-05-14$179,900 Active 637-char remark
-
2021-02-08soldstatus $89,000
ⓘ Source: listings_history table (triggers on properties + properties_extension) + one-shot
backfill from property_details.listing_events for pre-trigger history.
Tax reassessment forecast IN · Partial reset (capped growth)
- Current annual tax
- $994 · $83/mo
- Projected year-2 tax
- $1,155 · $96/mo
- Expected delta
- +$161/yr (+$13/mo · 16.2%)
ⓘ Screening estimate from a state-policy table — verify with the county assessor before closing.
Climate risk First Street
- Flood 3/10 Moderate FEMA zone X (unshaded) · 20% chance over 30 yrs
- Wildfire 1/10 Low
- Heat 2/10 Low 7 d/yr ≥99°F today · 16 d/yr by 30 yrs out
- Wind 2/10 Low
- Air quality 3/10 Moderate 2 unhealthy d/yr today · 3 by 30 yrs out
Nearby sold comps map
Loading sold comps map…
Walkable amenities ~0.75 mi
Loading nearby amenities…
Taxation est. · year 1
- Rental income
- $19,784
- − Mortgage interest
- −$8,677
- − Property taxes
- −$994
- − Insurance
- −$774
- − Repairs & maintenance
- −$1,583
- − Management
- −$1,583
- − Depreciation
- −$4,506
- Taxable income
- $1,667
- Est. tax owed @ 24.0%
- −$400
- After-tax cash flow
- $3,713/yr
For passive investors: Depreciation is non-cash, so a rental often shows a tax loss while cash-flowing — sheltering income. Rental losses are passive: they offset passive income freely, and up to $25,000/yr can offset ordinary (W-2) income if you actively participate and your MAGI is under $100k (phasing out to $0 by $150k); unused losses carry forward. On sale, claimed depreciation is recaptured at up to 25%, and gains may owe capital-gains tax (a 1031 exchange can defer both). Figures are a year-1 estimate at your 24.0% rate — not tax advice; consult a CPA.
Schools (NCES district)
- District
- South Bend Community School Corporation
- NCES district ID
- 1810290
- Math proficiency
- 12% ▼ -10.00%
- Reading proficiency
- 21% ▼ -6.00%
- Median HH income
- $41,935
- Composite
- 14.21/100
- National rank
- #9452
- State rank
- #284 of 301 in IN
Livability — Granger
- Score
- 78/100
- State rank
- #33
- US rank
- #2584
Category grades
Schools grade is shown separately in the Schools card above.
Census & demographics
- Census place
- Granger, IN
- City population
- 31,598
- Population (ZIP)
- 6,552
Population outlook (St. Joseph County) Hauer SSP2
- Today (2025)
- 273,186 people
- By 2030
- 273,594 · +0.1%
- By 2040
- 271,641 · -0.6%
- By 2050
- 269,187 · -1.5%
- By 2075
- 263,136 · -3.7%
- By 2100
- 245,659 · -10.1%
Race, ethnicity, and origin ACS 2023
- Neighborhood character
- Predominantly White (84%)
- Race & ethnicity
- White 84% Two or more races 8% Black 5% Asian 3% Hispanic / Latino 1%
- Common ancestry
- Romanian 7% Slovak 2% Iranian 2%
- Foreign-born
- 4% · Canada, China, Vietnam
- Languages at home
- 95% English-only · Spanish 1% Vietnamese 1% Arabic 1%
Political lean MEDSL · St. Joseph
- 2024 margin
- Toss-up / Even · D 50.0% · R 48.5% · Other 1.5%
- 2008→2024 swing
- -15.6pp toward R · 2008: 17.1pp · 2024: 1.5pp
- All cycles
- 2024: D+1.5 2020: D+5.8 2016: D+0.2 2012: D+3.5 2008: D+17.1
Not yet ingested
- Civics
- —
Market trends
- HPI YoY
- ▼ -90.65%
- Current HPI
- 213.5397
- Rent YoY
- —
- Metro
- —
- State GDP YoY
- ▲ 2.90%
- F500 in state
- 18
Industry mix (Fortune 500 HQ in IN)
| Industry | F500 HQs | Revenue |
|---|---|---|
| Industrial Machinery | 2 | $37B |
|
||
| Healthcare | 1 | $177B |
|
||
| Pharmaceuticals | 1 | $45B |
|
||
| Metals / Steel | 1 | $18B |
|
||
| Agriculture | 1 | $17B |
|
||
| Packaging | 1 | $12B |
|
||
Price history
+79.7% since first listed5 events — show timeline
- 2026-06-09 Price Changed $159,900 IRMLS
- 2026-06-02 Price Changed $165,000 IRMLS
- 2026-05-21 Price Changed $169,900 IRMLS
- 2026-05-14 Listed $179,900 IRMLS
- 2021-02-08 Sold (Public Records) $89,000 Public Records
Property tax history
-4.5%/yrLatest (2025): $994 · -12.2% YoY. Source: county tax records.
Cash-flow waterfall
monthlySold comps — $/sqft
last 12 mo · ≤1 miLoading sold comps…