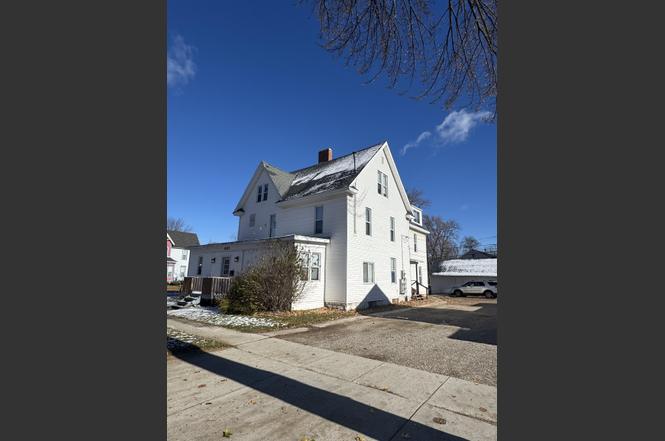
501 S University
Mount Pleasant, MI 48858
$359,900C+
None bd · None ba ·
— sqft ·
Built 1900
· MultiFamily
· Active
· 198 DOM
Cashflow @ list (25.0% down · 7.5%)
Estimated rent
$4,115/mo
Mortgage (P&I)
−$1,887
Tax + insurance
−$600
HOA
−$0
Vac / Maint / Mgmt
−$864
Net cashflow
$764/mo
Annual
$9,164/yr
Cap rate
8.84%
Cash-on-cash
9.09%
DSCR
1.40
1% rule
1.14%
Cash to close
$100,772
Investor read
- This is a 5 × 2-bed/1.5-bath units multifamily listed at $360k.
- At list price, monthly cash flow is $764 ($9k/yr) — positive. Per door: $153/mo.
- The deal already cash-flows at list — no discount required.
- Meets the 1% rule at list price ($4k rent vs $360k).
- It's been on market 198 days — a 12% lower offer ($317k) is reasonable based on typical stale-listing flexibility.
- Recommended offer: $317k (12.0% below list) — sets the bar for market timing.
- Local home prices are declining (-3.0%/yr); year-one equity from $2k of loan paydown is wiped out by about $11k of value loss. Plan a longer hold.
- Location reads 82/100 on livability (#55 in MI, #1,063 nationally) — a professional / high-income tenant draw. Strengths: amenities A+, cost of living A+, health & safety A+; Watch: crime C-, employment F.
- Mt. Pleasant City School District (town): math 33% / reading 48% proficiency, ranked #229 of 540 in MI (top 42%) — families likely to look elsewhere, expect single-tenant / working-renter base with shorter leases.
- Watch-outs: built in 1900 — expect roof / HVAC / electrical / plumbing capex.
- Market conditions: Rents rising fast (+16.9%/yr); 249 active listings in the ZIP; 2 comparable units currently listed for rent nearby; 72 units permitted in Isabella County in 2024 (0 in 5+ unit buildings).
- Isabella County population projected at +9% by 2050 — modest demand growth; plan on rents tracking national, not racing it.
- 15 sale attempts since 5y ago; this cycle's ask is 56134% above the opening price — seller raised mid-cycle; expect resistance to lowballs.
- At projected returns (-3.0% appreciation + 8.0% rent growth), your $101k cash investment doubles in ~8 years — after that, you're playing with house money.
- Cap rate 8.8% vs local median 3.4% in Mount Pleasant — top-decile yield for the area; either an underpriced asset or a hidden risk that comps aren't pricing in. Stress-test before assuming the spread holds.
- At $4,115/mo this rent would consume 96% of the median local household income ($51k/yr) (locally 2381% of renters already pay >50% of income on rent) — very limited rent-growth headroom before tenants either downsize or default.
Questions for listing agent
- It's been on market 198 days. Have you received any prior offers? Is the seller open to a 12% concession, seller financing, or rate buy-down credit?
- Can we see the unit-by-unit rent roll, current vacancy, and any below-market leases? What's the average tenancy length?
- What capital expenditures (roof, boiler, parking lot, exteriors) have been made in the last 5 years, and what's planned in the next 2?
- Built in 1900 — when were the roof, HVAC, electrical panel, plumbing, and water heater last replaced?
- Why hasn't it sold? Are there any deal-killer items the seller is aware of (foundation, flood, title, zoning, code violations)?
- Is there a deadline driving the sale (1031 exchange, divorce, estate, relocation)? That informs how much negotiation room exists.
- Schools are B-rated — typically a magnet for longer-tenancy family renters. What's the average tenant stay here, and is there a school-zone premium baked into asking?
- What's the average days-on-market for RENTAL listings here right now (not sales)? A rising rental-DOM trend means longer vacancies and softer asking-rent achievability than the comps imply.
CashFlowRE · CFR-7RNFQD3TTT00HP
· Data 1 day ago
cashflowre.app · 2026-05-29