 5-Plex
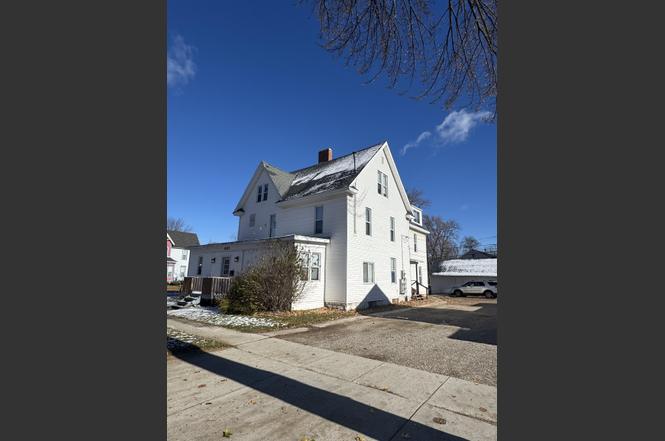
501 S University · Mount Pleasant, MI
Flood risk 1/10 · Minimal
- FEMA flood zone
- X (unshaded)
- Chance of flooding over 30 yrs
- 0.0%
- Est. flood insurance / yr
- $473 – $860
Fire risk 1/10 · Minimal
- Est. fire insurance / yr
- $784 – $1,456
Heat risk 2/10 · Minimal
- Hot days now (above 97°F)
- 6 days/yr
- Hot days in 30 yrs
- 13 days/yr
Wind risk 1/10 · Minimal
- Chance of severe wind over 30 yrs
- —
Air-quality risk 2/10 · Minimal
- Unhealthy air days now
- 1 days/yr
- Unhealthy air days in 30 yrs
- 2 days/yr
Risk factors via First Street. Map © Google.
Why this score? — see what drove the C+ grade
The composite is a weighted blend of 9 inputs, each scored 0–100. Each bar is that input's sub-score; the figure is the points it added to the 100-point composite (weight × sub-score).
- Cash flow +24.8/30.0
- DSCR +8.0/10.0
- ARV discount +7.5/15.0
- 1% rule +6.4/10.0
- Rent growth +5.0/5.0
- Livability +4.1/5.0
- Schools +3.3/10.0
- Condition / age +2.5/5.0
- Appreciation +0.0/10.0
$359,900
🖨 Deal sheet 📄 Offer letter ✓ Due diligence
Multi-family units
County records classify this as Multi-Family (5+ Unit). Listing-text estimate: 5 units. confirmed
5+ unit building — per-unit beds/baths from public records are typically unavailable; the breakdown below (if shown) is an estimate from the listing text.
Listing remarks MLS
Fully Occupied 5-Unit Investment Property on a Corner Lot with Proven Rental History. Fully leased until 2027, with management with good track record in place! Exceptional investment opportunity! This fully occupied 5-unit multifamily property sits proudly on a prime corner lot, offering excellent visibility and curb appeal. With a strong rental history and stable, long-term tenants, this property delivers consistent cash flow and minimal vacancy. Each unit is well-maintained and thoughtfully designed, featuring functional layouts that attract and retain quality renters. The property has been professionally managed and regularly updated, ensuring low maintenance costs and tenant satisfaction. Additional highlights include separate utilities, ample off-street parking, and a convenient location close to public transportation, shopping, and local amenities. Whether you’re a seasoned investor or looking to expand your portfolio, this turnkey property offers immediate income and long-term growth potential. Don’t miss your chance to own a solid, income-producing asset in a desirable neighborhood! Unit 1 800 square foot 3 bed 1 bath Unit 2 700 square foot 2 bed 1 bath Unit 3 900 square foot 3 bed 1 bath Unit 4 450 square foot 1 bed 1 bath Unit 5 1000 square foot 4 bed 1 bath Rents Currently $500-$900 per month Leases are signed in place until 2027
Key facts
- Excellent visibility
- Curb appeal
- Corner lot
Tags
Property features AI
Exterior
- Parking: Detached garage
- Utilities: Public water; Public sewer
- Home design: Multi-family residential property; Two levels
- Construction: Block foundation
- Exterior features: Lot approximately 70 x 115 (0.18 acres); Pets allowed
Interior
- Kitchen: Oven, Refrigerator, Range
- Flooring: Hardwood
- Heating & cooling: Forced air heating; Hot water heating; Natural gas heating; Window air conditioning units
- Interior features: Oven, Refrigerator, Range; Hardwood flooring; Partial block basement
Neighborhood map
What this means for you Summary
Snapshot
- This is a 5 × 2-bed/1.5-bath units multifamily listed at $360k.
Deal economics
- At list price, monthly cash flow is $764 ($9k/yr) — positive. Per door: $153/mo.
- The deal already cash-flows at list — no discount required.
- Meets the 1% rule at list price ($4k rent vs $360k).
- Recommended offer: $317k (12.0% below list) — sets the bar for market timing.
- Cap rate 8.8% vs local median 3.4% in Mount Pleasant — top-decile yield for the area; either an underpriced asset or a hidden risk that comps aren't pricing in. Stress-test before assuming the spread holds.
Location & tenants
- Location reads 82/100 on livability (#55 in MI, #1,063 nationally) — a professional / high-income tenant draw. Strengths: amenities A+, cost of living A+, health & safety A+; Watch: crime C-, employment F.
- Mt. Pleasant City School District (town): math 33% / reading 48% proficiency, ranked #229 of 540 in MI (top 42%) — families likely to look elsewhere, expect single-tenant / working-renter base with shorter leases.
- Market conditions: Rents rising fast (+16.9%/yr); 249 active listings in the ZIP; 2 comparable units currently listed for rent nearby; 72 units permitted in Isabella County in 2024 (0 in 5+ unit buildings).
- At $4,115/mo this rent would consume 96% of the median local household income ($51k/yr) (locally 2381% of renters already pay >50% of income on rent) — very limited rent-growth headroom before tenants either downsize or default.
Forward outlook
- Local home prices are declining (-3.0%/yr); year-one equity from $2k of loan paydown is wiped out by about $11k of value loss. Plan a longer hold.
- Isabella County population projected at +9% by 2050 — modest demand growth; plan on rents tracking national, not racing it.
- At projected returns (-3.0% appreciation + 8.0% rent growth), your $101k cash investment doubles in ~8 years — after that, you're playing with house money.
Negotiation context
- It's been on market 198 days — a 12% lower offer ($317k) is reasonable based on typical stale-listing flexibility.
- 15 sale attempts since 5y ago; this cycle's ask is 56134% above the opening price — seller raised mid-cycle; expect resistance to lowballs.
Risks & watch-outs
- Watch-outs: built in 1900 — expect roof / HVAC / electrical / plumbing capex.
Questions for the listing agent
- It's been on market 198 days. Have you received any prior offers? Is the seller open to a 12% concession, seller financing, or rate buy-down credit?
- Can we see the unit-by-unit rent roll, current vacancy, and any below-market leases? What's the average tenancy length?
- What capital expenditures (roof, boiler, parking lot, exteriors) have been made in the last 5 years, and what's planned in the next 2?
- Built in 1900 — when were the roof, HVAC, electrical panel, plumbing, and water heater last replaced?
- Why hasn't it sold? Are there any deal-killer items the seller is aware of (foundation, flood, title, zoning, code violations)?
- Is there a deadline driving the sale (1031 exchange, divorce, estate, relocation)? That informs how much negotiation room exists.
- Schools are B-rated — typically a magnet for longer-tenancy family renters. What's the average tenant stay here, and is there a school-zone premium baked into asking?
- What's the average days-on-market for RENTAL listings here right now (not sales)? A rising rental-DOM trend means longer vacancies and softer asking-rent achievability than the comps imply.
- What's the recent tenant-quality profile in this submarket — average credit score on applications, eviction rate, late-payment / NSF rate, and stable-employment percentage? A property-management company in the area should have these aggregated.
- How much new apartment / multifamily construction is in the pipeline within 1–3 miles? Heavy new supply (>2% of stock underway) typically softens rents 12–24 months out; light construction supports rent growth.
Investment metrics
- 1% rule
- 1.14% ✓
- Cap rate
- 8.84%
- Cash-on-cash
- 9.09%
- DSCR
- 1.40
- GRM
- 7.3
CMA / ARV
No comps found within radius.
Show comp detail 12 sales within ~0.75 mi
| Address | Dist | Beds/Ba | Sqft | Sold | Price | $/sf | Match |
|---|---|---|---|---|---|---|---|
| 530 S Pine St | 0.21mi | —/— | 1,469 | 10mo | $150,000 | $102 | 69 |
| 530 S Pine St Lot : 8 | 0.21mi | —/— | 1,469 | 10mo | $150,000 | $102 | 69 |
| 1011 S Lansing St | 0.40mi | —/— | 660 | 2mo | $140,000 | $212 | 67 |
| 1026 S Fancher Ave | 0.40mi | —/— | 1,296 | 2mo | $216,000 | $167 | 67 |
| 316 N University | 0.47mi | —/— | — | 9mo | $165,900 | — | 58 |
| 1005 & 1007 E Michigan | 0.59mi | —/— | 2,080 | 3mo | $309,500 | $149 | 58 |
| 322 N Arnold | 0.57mi | —/— | — | 7mo | $100,000 | — | 55 |
| 413 N Fancher St | 0.55mi | —/— | — | 10mo | $177,000 | — | 53 |
| 601 N Fancher St | 0.64mi | —/— | 1,650 | 7mo | $165,000 | $100 | 52 |
| 211 E Bennett St | 0.69mi | —/— | — | 5mo | $141,000 | — | 51 |
| 708 N Main St | 0.71mi | —/— | 721 | 5mo | $127,000 | $176 | 50 |
| 817 Crosslanes St | 0.70mi | —/— | 360 | 10mo | $90,000 | $250 | 46 |
Match score weights: distance 35% · size 25% · config 20% · recency 20%. Top-matched comps best support the ARV.
Projected returns pro-forma
-3.0% appreciation · 8.0% rent growth · sell at horizon
- IRR
- 3.0%
- Equity multiple
- 1.12×
- Total profit
- $12,128
- Equity at exit
- $53,662
- IRR
- 16.8%
- Equity multiple
- 2.71×
- Total profit
- $172,421
- Equity at exit
- $31,118
Cash invested: $100,772 (down + closing). Projections, not guarantees.
Landlord ↔ Tenant lean methodology
- Overall (STATE)
- 62 Landlord-Friendly
- State Michigan
- 62 Landlord-Friendly · EVEN
- County
- — inherits STATE
- City
- — inherits STATE
ZIP-level market 48858
- Home prices YoY
- -31.9%
- Rents YoY
- 16.9%
- Active inventory
- 249
- Price-to-rent
- 36.4×
Monthly cashflow live
- Estimated rent
- $4,115 medium interval (Pro) →
- Mortgage (P&I)
- −$1,887
- Tax est. 1.5%
- −$450 /mo · $5,398/yr
- Insurance
- −$150
- HOA
- −$0
- Vacancy / Maint / Mgmt
- −$864
- Net cashflow
- $764
Break-even live
5-unit breakdown (identical units grouped — click to expand)
| Units | Beds | Baths | Est. rent |
|---|---|---|---|
| 5× units | 2 | 1.5 | $4,115 |
| #1 | 2 | 1.5 | $823 |
| #2 | 2 | 1.5 | $823 |
| #3 | 2 | 1.5 | $823 |
| #4 | 2 | 1.5 | $823 |
| #5 | 2 | 1.5 | $823 |
| Total (5 units) | $4,115 | ||
UW: 25.0% down · 7.5% · 30yr · 1.5% tax · 5.0% vac · 8.0% maint · 8.0% mgmt
Financing live
Cash to close
- Down payment
- $89,975
- Closing costs
- $10,797
- Reserves months
- —
- Total cash needed
- —
Loan-product check · same deal, 3 products live
Conventional
25% down · 7.5% · 30yr
- Down + closing
- —
- Monthly P&I
- —
- Monthly cashflow
- —
- DSCR
- —
- Eligible?
- —
Personal DTI + credit; lowest rate.
DSCR
20% down · 8.5% · 30yr
- Down + closing
- —
- Monthly P&I
- —
- Monthly cashflow
- —
- DSCR
- —
- Eligible?
- —
No personal income docs; deal must DSCR.
Hard money
10% down · 12.0% · 12mo
- Down + closing
- —
- Monthly P&I
- —
- Monthly cashflow
- —
- DSCR
- —
- Eligible?
- —
Short-term bridge; refi at stabilization.
Rent comps 2 comps
| Address | Beds | Baths | Sqft | Rent | $/sqft | DOM | Units | Dist |
|---|---|---|---|---|---|---|---|---|
| 950 Appian Way Mt Pleasant, MI | 2.0 | 1.0 | 850 | $850 | $1.00 | 43d | 1 | 1.16mi |
| 1815 Deming Dr Mt Pleasant, MI | 2.0–6.0 | 1.0–2.0 | 1319 | $310 | $0.24 | 43d | 1 | 1.23mi |
Listing history 45 events
-
2026-06-19days on market $359,900 Active 198 DOM
-
2026-06-18days on market $359,900 Active 197 DOM
-
2026-06-17days on market $359,900 Active 196 DOM
-
2026-06-16days on market $359,900 Active 195 DOM
-
2026-06-15days on market $359,900 Active 194 DOM
-
2026-06-14days on market $359,900 Active 192 DOM
-
2026-06-12days on market $359,900 Active 191 DOM
-
2026-06-09days on market $359,900 Active 188 DOM
-
2026-06-08days on market $359,900 Active 187 DOM
-
2026-06-07days on market $359,900 Active 186 DOM
-
2026-06-05days on market $359,900 Active 183 DOM
-
2026-06-03days on market $359,900 Active 182 DOM
-
2026-06-02days on market $359,900 Active 181 DOM
-
2026-06-01days on market $359,900 Active 180 DOM
-
2026-05-31days on market $359,900 Active 179 DOM
-
2026-05-30days on market $359,900 Active 178 DOM
-
2026-05-22price $359,900 1400-char remark
Show marketing remark (1400 chars)
Fully Occupied 5-Unit Investment Property on a Corner Lot with Proven Rental History. Fully leased until 2027, with management with good track record in place! Exceptional investment opportunity! This fully occupied 5-unit multifamily property sits proudly on a prime corner lot, offering excellent visibility and curb appeal. With a strong rental history and stable, long-term tenants, this property delivers consistent cash flow and minimal vacancy. Each unit is well-maintained and thoughtfully designed, featuring functional layouts that attract and retain quality renters. The property has been professionally managed and regularly updated, ensuring low maintenance costs and tenant satisfaction. Additional highlights include separate utilities, ample off-street parking, and a convenient location close to public transportation, shopping, and local amenities. Whether you’re a seasoned investor or looking to expand your portfolio, this turnkey property offers immediate income and long-term growth potential. Don’t miss your chance to own a solid, income-producing asset in a desirable neighborhood! Unit 1 800 square foot 3 bed 1 bath Unit 2 700 square foot 2 bed 1 bath Unit 3 900 square foot 3 bed 1 bath Unit 4 450 square foot 1 bed 1 bath Unit 5 1000 square foot 4 bed 1 bath Rents Currently $500-$900 per month Leases are signed in place until 2027
-
2026-05-21price $359,900
-
2026-05-06$640
-
2026-05-05historical $640
-
2026-05-05$640
-
2026-03-17$820
-
2025-12-23status Active
-
2025-12-22historical
-
2025-12-03$375,000 Active 1400-char remark
Show marketing remark (1400 chars)
Fully Occupied 5-Unit Investment Property on a Corner Lot with Proven Rental History. Fully leased until 2027, with management with good track record in place! Exceptional investment opportunity! This fully occupied 5-unit multifamily property sits proudly on a prime corner lot, offering excellent visibility and curb appeal. With a strong rental history and stable, long-term tenants, this property delivers consistent cash flow and minimal vacancy. Each unit is well-maintained and thoughtfully designed, featuring functional layouts that attract and retain quality renters. The property has been professionally managed and regularly updated, ensuring low maintenance costs and tenant satisfaction. Additional highlights include separate utilities, ample off-street parking, and a convenient location close to public transportation, shopping, and local amenities. Whether you’re a seasoned investor or looking to expand your portfolio, this turnkey property offers immediate income and long-term growth potential. Don’t miss your chance to own a solid, income-producing asset in a desirable neighborhood! Unit 1 800 square foot 3 bed 1 bath Unit 2 700 square foot 2 bed 1 bath Unit 3 900 square foot 3 bed 1 bath Unit 4 450 square foot 1 bed 1 bath Unit 5 1000 square foot 4 bed 1 bath Rents Currently $500-$900 per month Leases are signed in place until 2027
-
2025-12-03$375,000 Active
Show marketing remark (1400 chars)
Fully Occupied 5-Unit Investment Property on a Corner Lot with Proven Rental History. Fully leased until 2027, with management with good track record in place! Exceptional investment opportunity! This fully occupied 5-unit multifamily property sits proudly on a prime corner lot, offering excellent visibility and curb appeal. With a strong rental history and stable, long-term tenants, this property delivers consistent cash flow and minimal vacancy. Each unit is well-maintained and thoughtfully designed, featuring functional layouts that attract and retain quality renters. The property has been professionally managed and regularly updated, ensuring low maintenance costs and tenant satisfaction. Additional highlights include separate utilities, ample off-street parking, and a convenient location close to public transportation, shopping, and local amenities. Whether you’re a seasoned investor or looking to expand your portfolio, this turnkey property offers immediate income and long-term growth potential. Don’t miss your chance to own a solid, income-producing asset in a desirable neighborhood! Unit 1 800 square foot 3 bed 1 bath Unit 2 700 square foot 2 bed 1 bath Unit 3 900 square foot 3 bed 1 bath Unit 4 450 square foot 1 bed 1 bath Unit 5 1000 square foot 4 bed 1 bath Rents Currently $500-$900 per month Leases are signed in place until 2027
-
2025-07-23historical $620
-
2025-05-01historical $620
-
2025-05-01$620
-
2025-03-13historical $620
-
2025-03-13$620
-
2025-02-17historical
-
2025-02-14$620
-
2024-08-03historical $550
-
2024-07-19$550
-
2024-04-26historical $550
-
2024-04-24historical
-
2024-03-12$550
-
2023-11-10historical $750
-
2023-10-04$750
-
2023-04-26$324,900 Active
-
2023-04-26$324,900 Active
-
2022-11-16historical
-
2021-11-12historical
-
2021-05-13$274,900
ⓘ Source: listings_history table (triggers on properties + properties_extension) + one-shot
backfill from property_details.listing_events for pre-trigger history.
Climate risk First Street
- Flood 1/10 Low FEMA zone X (unshaded) · 0% chance over 30 yrs
- Wildfire 1/10 Low
- Heat 2/10 Low 6 d/yr ≥97°F today · 13 d/yr by 30 yrs out
- Wind 1/10 Low
- Air quality 2/10 Low 1 unhealthy d/yr today · 2 by 30 yrs out
Nearby sold comps map
Loading sold comps map…
Walkable amenities ~0.75 mi
Loading nearby amenities…
Taxation est. · year 1
- Rental income
- $49,380
- − Mortgage interest
- −$20,160
- − Property taxes
- −$5,398
- − Insurance
- −$1,800
- − Repairs & maintenance
- −$3,950
- − Management
- −$3,950
- − Depreciation
- −$10,470
- Taxable income
- $3,651
- Est. tax owed @ 24.0%
- −$876
- After-tax cash flow
- $8,288/yr
For passive investors: Depreciation is non-cash, so a rental often shows a tax loss while cash-flowing — sheltering income. Rental losses are passive: they offset passive income freely, and up to $25,000/yr can offset ordinary (W-2) income if you actively participate and your MAGI is under $100k (phasing out to $0 by $150k); unused losses carry forward. On sale, claimed depreciation is recaptured at up to 25%, and gains may owe capital-gains tax (a 1031 exchange can defer both). Figures are a year-1 estimate at your 24.0% rate — not tax advice; consult a CPA.
Schools (NCES district)
- District
- Mt. Pleasant City School District
- NCES district ID
- 2624750
- Math proficiency
- 33% ▼ -5.00%
- Reading proficiency
- 48% ▼ -3.00%
- Median HH income
- $32,344
- Composite
- 33.16/100
- National rank
- #5548
- State rank
- #229 of 540 in MI
Livability — Mount Pleasant
- Score
- 82/100
- State rank
- #55
- US rank
- #1063
Category grades
Schools grade is shown separately in the Schools card above.
Census & demographics
- Census place
- Mount Pleasant, MI
- County
- Isabella County · 42,226 people
- City population
- 42,226
- Metro
- Mount Pleasant, MI
- Population (ZIP)
- 42,226
- Household income
- $51,267
- Rent vs Own
- Severe rent burden
- 2381.0
Population outlook (Isabella County) Hauer SSP2
- Today (2025)
- 75,111 people
- By 2030
- 77,600 · +3.3%
- By 2040
- 79,890 · +6.4%
- By 2050
- 81,568 · +8.6%
- By 2075
- 86,602 · +15.3%
- By 2100
- 92,201 · +22.8%
Race, ethnicity, and origin ACS 2023
- Neighborhood character
- Predominantly White (81%)
- Race & ethnicity
- White 81% Two or more races 6% Hispanic / Latino 5% Native American 4% Black 3% Asian 2%
- Hispanic origin (detail)
- Mexican 3%
- Common ancestry
- Romanian 6% Slovak 3% Iranian 3%
- Foreign-born
- 4% · Canada
- Languages at home
- 94% English-only · Spanish 2% Other Indo-European 1% German/W. Germanic 0%
Political lean MEDSL · Isabella
- 2024 margin
- Lean R (+7.5) · D 45.5% · R 53.0% · Other 1.6%
- 2008→2024 swing
- -26.7pp toward R · 2008: 19.2pp · 2024: -7.5pp
- All cycles
- 2024: R+7.5 2020: R+2.5 2016: R+3.7 2012: D+9.3 2008: D+19.2
Not yet ingested
- Civics
- —
Market trends
- HPI YoY
- ▼ -96.75%
- Current HPI
- 206.1153
- Rent YoY
- ▲ 16.89%
- Metro
- Mount Pleasant, MI
- State GDP YoY
- ▲ 1.37%
- F500 in state
- 28
Industry mix (Fortune 500 HQ in MI)
| Industry | F500 HQs | Revenue |
|---|---|---|
| Automotive Parts | 3 | $48B |
|
||
| Automotive | 2 | $372B |
|
||
| Chemicals | 1 | $45B |
|
||
| Automotive Retail | 1 | $29B |
|
||
| Healthcare / Medical Devices | 1 | $23B |
|
||
| Automotive Technology | 1 | $20B |
|
||
Price history
+30.9% since first listed29 events — show timeline
- 2026-05-22 Price Changed $359,900 MiRealSource-MiMLS
- 2026-05-21 Price Changed $359,900 REALCOMP
- 2026-05-06 Listed for Rent $640 BUILDIUM
- 2026-05-05 Rental Removed $640 TENANTTURNER2
- 2026-05-05 Listed for Rent $640 TENANTTURNER2
- 2026-03-17 Listed for Rent $820 BUILDIUM
- 2025-12-23 Relisted — REALCOMP
- 2025-12-22 Listing Removed — REALCOMP
- 2025-12-03 Listed $375,000 REALCOMP
- 2025-12-03 Listed $375,000 MiRealSource-MiMLS
- 2025-07-23 Rental Removed $620 TENANTTURNER2
- 2025-05-01 Rental Removed $620 BUILDIUM
- 2025-05-01 Listed for Rent $620 TENANTTURNER2
- 2025-03-13 Rental Removed $620 BUILDIUM
- 2025-03-13 Listed for Rent $620 BUILDIUM
- 2025-02-17 Listing Removed — REALCOMP
- 2025-02-14 Listed for Rent $620 BUILDIUM
- 2024-08-03 Rental Removed $550 BUILDIUM
- 2024-07-19 Listed for Rent $550 BUILDIUM
- 2024-04-26 Rental Removed $550 BUILDIUM
- 2024-04-24 Listing Removed — MiRealSource-MiMLS
- 2024-03-12 Listed for Rent $550 BUILDIUM
- 2023-11-10 Rental Removed $750 BUILDIUM
- 2023-10-04 Listed for Rent $750 BUILDIUM
- 2023-04-26 Listed $324,900 MiRealSource-MiMLS
- 2023-04-26 Listed $324,900 REALCOMP
- 2022-11-16 Rental Removed — BUILDIUM
- 2021-11-12 Listing Removed — REALCOMP
- 2021-05-13 Listed $274,900 REALCOMP
Cash-flow waterfall
monthlySold comps — $/sqft
last 12 mo · ≤1 miLoading sold comps…