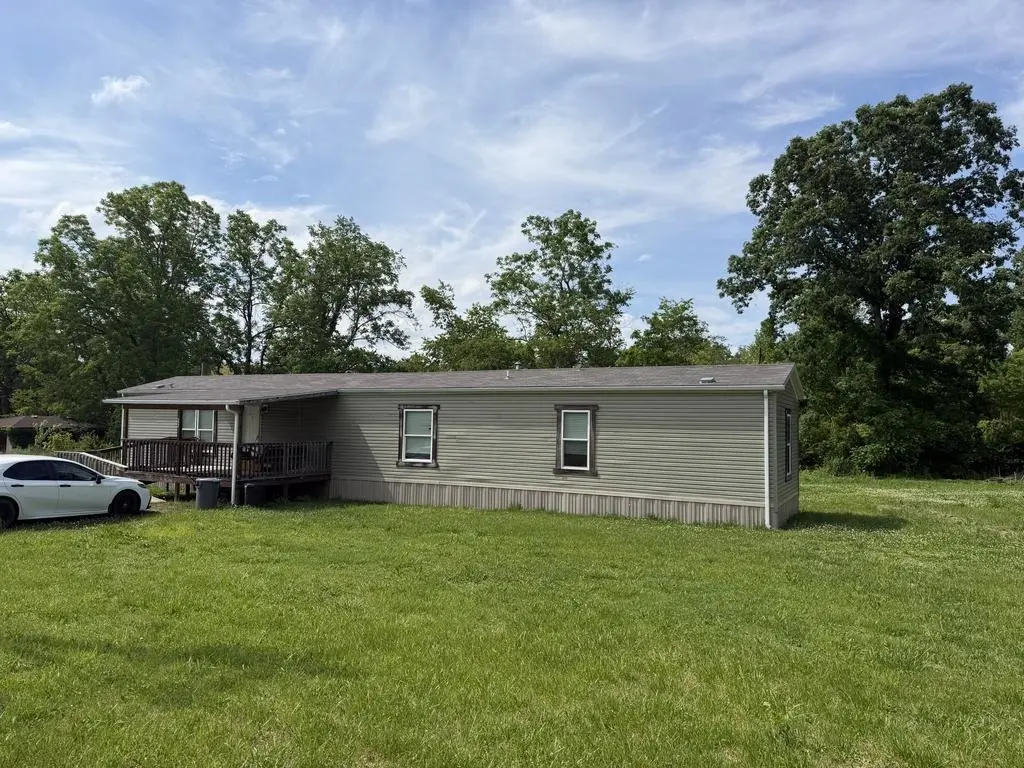
345 Canoe Run Run
Grayson, KY 41143
$99,000D+
3 bd · 2.0 ba ·
1,280 sqft ·
Built 2020
· SingleFamily
· Active
· 9 DOM
Cashflow @ list (25.0% down · 7.5%)
Estimated rent
$863/mo
Mortgage (P&I)
−$519
Tax + insurance
−$231
HOA
−$0
Vac / Maint / Mgmt
−$181
Net cashflow
$-69/mo
Annual
$-826/yr
Cap rate
6.26%
Cash-on-cash
-0.10%
DSCR
1.00
1% rule
0.87%
Cash to close
$27,720
Investor read
- This is a 3-bed/2.0-bath single-family listed at $99k.
- At list price, monthly cash flow is $-69 ($-826/yr) — negative.
- To cash-flow at today's rent, offer at most $89k (10.1% below list).
- To meet the 1% rule (rent ≥ 1% of price), the offer needs to be $86k (12.8% below list).
- Only 9 days on market — expect competitive offers; lowballing is unlikely to land.
- Recommended offer: $86k (12.8% below list) — sets the bar for 1% rule.
- In year one you build about $11k of equity ($684 loan paydown + $10k appreciation (10.0% local appreciation)).
- Location reads 70/100 on livability (#161 in KY) — a middle-class / working-renter tenant base. Strengths: cost of living A+, health & safety A+, housing B; Watch: amenities D+, commute F, employment F.
- Carter County (rural): math 27% / reading 43% proficiency, ranked #70 of 165 in KY (top 42%) — families likely to look elsewhere, expect single-tenant / working-renter base with shorter leases.
- Watch-outs: flood insurance adds $66/mo.
- Market conditions: 62 active listings in the ZIP; 1 comparable units currently listed for rent nearby; 1 units permitted in Carter County in 2024 (0 in 5+ unit buildings).
- Carter County population projected at -21% by 2050 — secular population decline; favor cash flow + early exit over multi-decade hold.
- Current owner paid $82k; 21% above their basis — modest negotiation headroom, anchor on the comps not their cost.
- At projected returns (10.0% appreciation + 3.0% rent growth), your $28k cash investment doubles in ~3 years — after that, you're playing with house money.
- By year 4, paydown + projected appreciation supports a ~$38k cash-out refi (75% LTV) — recoverable capital for the next deal without selling this one.
- Climate carrying-cost: severe flood risk; severe wildfire risk — expect insurance premiums to compound above CPI over the hold.
- Cap rate 6.3% vs local median 4.6% in Grayson — top-decile yield for the area; either an underpriced asset or a hidden risk that comps aren't pricing in. Stress-test before assuming the spread holds.
Questions for listing agent
- What do current leases actually rent for vs. the listed asking? Can we see a recent rent roll and the last 12 months of T-12 income?
- What's the actual annual flood-insurance premium (NFIP or private), and is the property in a SFHA with mandatory coverage?
- Is there a deadline driving the sale (1031 exchange, divorce, estate, relocation)? That informs how much negotiation room exists.
- The area grade is low — what's the realistic commute time and amenity access for the typical tenant pool here? Any planned neighborhood developments (good or bad) we should know about?
- What's the average days-on-market for RENTAL listings here right now (not sales)? A rising rental-DOM trend means longer vacancies and softer asking-rent achievability than the comps imply.
- What's the recent tenant-quality profile in this submarket — average credit score on applications, eviction rate, late-payment / NSF rate, and stable-employment percentage? A property-management company in the area should have these aggregated.
- How much new for-sale + rental construction is in the pipeline within 1–3 miles? Heavy new supply typically softens prices + rents 12–24 months out; constrained supply supports both.
CashFlowRE · CFR-7RP9YPDMS7E08E
· Data 2 days ago
cashflowre.app · 2026-05-29