10711 Sherman Grv #36
Los Angeles, CA 91040
$175,000C+
2 bd · 1.5 ba ·
1,000 sqft ·
Built 1963
· Manufactured
· Active
· 135 DOM
Cashflow @ list (25.0% down · 7.5%)
Estimated rent
$2,960/mo
Mortgage (P&I)
−$918
Tax + insurance
−$358
HOA
−$0
Vac / Maint / Mgmt
−$622
Net cashflow
$1,063/mo
Annual
$12,750/yr
Cap rate
14.03%
Cash-on-cash
27.65%
DSCR
2.23
1% rule
1.69%
Cash to close
$49,000
Investor read
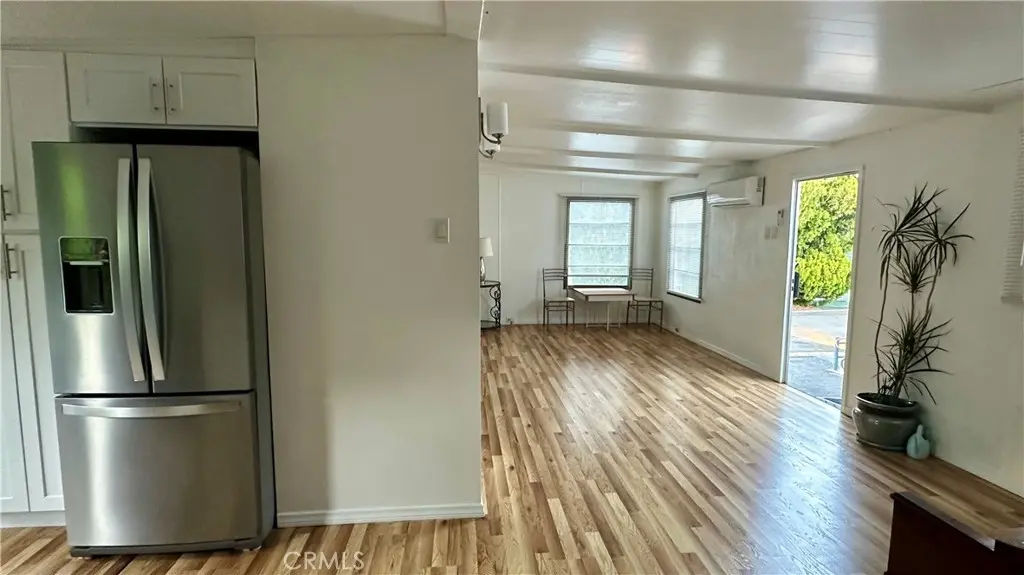
- This is a 2-bed/1.5-bath manufactured listed at $175k. Condition is rated good.
- At list price, monthly cash flow is $1k ($13k/yr) — positive.
- The deal already cash-flows at list — no discount required.
- Meets the 1% rule at list price ($3k rent vs $175k).
- It's been on market 135 days — a 12% lower offer ($154k) is reasonable based on typical stale-listing flexibility.
- Recommended offer: $154k (12.0% below list) — sets the bar for market timing.
- Local home prices are declining (-3.0%/yr); year-one equity from $1k of loan paydown is wiped out by about $5k of value loss. Plan a longer hold.
- Location reads 68/100 on livability (#273 in CA) — a middle-class / working-renter tenant base. Strengths: amenities A+, commute A+, employment B; Watch: health & safety C-, crime F, cost of living F.
- Los Angeles Unified (urban): math 29% / reading 54% proficiency, ranked #223 of 517 in CA (top 43%) — families likely to look elsewhere, expect single-tenant / working-renter base with shorter leases; 67% free/reduced lunch — lower-income household profile, screen leases tightly.
- Zoned schools: Sunland Elementary (289 students, 72% FRL); Mt. Gleason Middle (744 students, 79% FRL); Verdugo Hills Senior High (math 52% / reading 77%, grade B-, #165 of 1,170 statewide, top 15%, 1,195 students, 81% FRL).
- Zoned-school proficiency averages 64% at this address vs 42% district-wide (+23 pts) — the actual schools serving this property are materially stronger than the Los Angeles Unified average implies; a family-tenant draw the district grade alone would hide.
- Watch-outs: flood insurance adds $66/mo.
- Market conditions: 74 active listings in the ZIP; 40 comparable units currently listed for rent nearby; rentals at typical pace (median 24d on market — plan ~3-4 weeks tenant-placement turnaround); solid renter incomes; 19,697 units permitted in Los Angeles County in 2024 (9,426 in 5+ unit buildings).
- Los Angeles County population projected at +9% by 2050 — modest demand growth; plan on rents tracking national, not racing it.
- 3 sale attempts since 2y ago with the ask held roughly flat each time — persistent listings suggest the price (not the market) is what's stuck; bring a comps-based counter.
- Current owner paid $76k; list at $175k implies a 130% gain — meaningful room to come down on a strong offer.
- At projected returns (-3.0% appreciation + 3.0% rent growth), your $49k cash investment doubles in ~5 years — after that, you're playing with house money.
- Climate carrying-cost: major flood risk; severe wildfire risk; extreme-heat days projected 7→19/yr by 2055 (HVAC capex compounding) — expect insurance premiums to compound above CPI over the hold.
Questions for listing agent
- It's been on market 135 days. Have you received any prior offers? Is the seller open to a 12% concession, seller financing, or rate buy-down credit?
- Built in 1963 — when were the roof, HVAC, electrical panel, plumbing, and water heater last replaced?
- What's the actual annual flood-insurance premium (NFIP or private), and is the property in a SFHA with mandatory coverage?
- Why hasn't it sold? Are there any deal-killer items the seller is aware of (foundation, flood, title, zoning, code violations)?
- Is there a deadline driving the sale (1031 exchange, divorce, estate, relocation)? That informs how much negotiation room exists.
- Schools are D-rated, which usually means shorter tenancies and higher turnover. Who's the typical renter profile here, and what's been the actual vacancy rate?
- Crime grade is F in this area — have there been break-ins, vandalism, or insurance claims at this property in the last 3 years? What carrier currently insures it and at what premium?
- What's the average days-on-market for RENTAL listings here right now (not sales)? A rising rental-DOM trend means longer vacancies and softer asking-rent achievability than the comps imply.
CashFlowRE · CFR-7SDV3NCD15JD3V
· Data 20 h ago
cashflowre.app · 2026-05-29