10711 Sherman Grv #36 · Los Angeles, CA
Flood risk 7/10 · Major
- FEMA flood zone
- X (unshaded)
- Chance of flooding over 30 yrs
- 0.78%
- Est. flood insurance / yr
- $507 – $1,088
Fire risk 8/10 · Major
- Est. fire insurance / yr
- $659 – $1,223
Heat risk 5/10 · Moderate
- Hot days now (above 97°F)
- 7 days/yr
- Hot days in 30 yrs
- 19 days/yr
Wind risk 1/10 · Minimal
- Chance of severe wind over 30 yrs
- —
Air-quality risk 9/10 · Severe
- Unhealthy air days now
- 18 days/yr
- Unhealthy air days in 30 yrs
- 21 days/yr
Risk factors via First Street. Map © Google.
Why this score? — see what drove the C+ grade
The composite is a weighted blend of 9 inputs, each scored 0–100. Each bar is that input's sub-score; the figure is the points it added to the 100-point composite (weight × sub-score).
- Cash flow +30.0/30.0
- 1% rule +10.0/10.0
- DSCR +10.0/10.0
- Condition / age +4.0/5.0
- Schools +3.6/10.0
- Livability +3.4/5.0
- Rent growth +2.5/5.0
- ARV discount +0.0/15.0
- Appreciation +0.0/10.0
$175,000
🖨 Deal sheet (PDF) 📄 Offer letter ✓ Due diligence
Listing remarks MLS
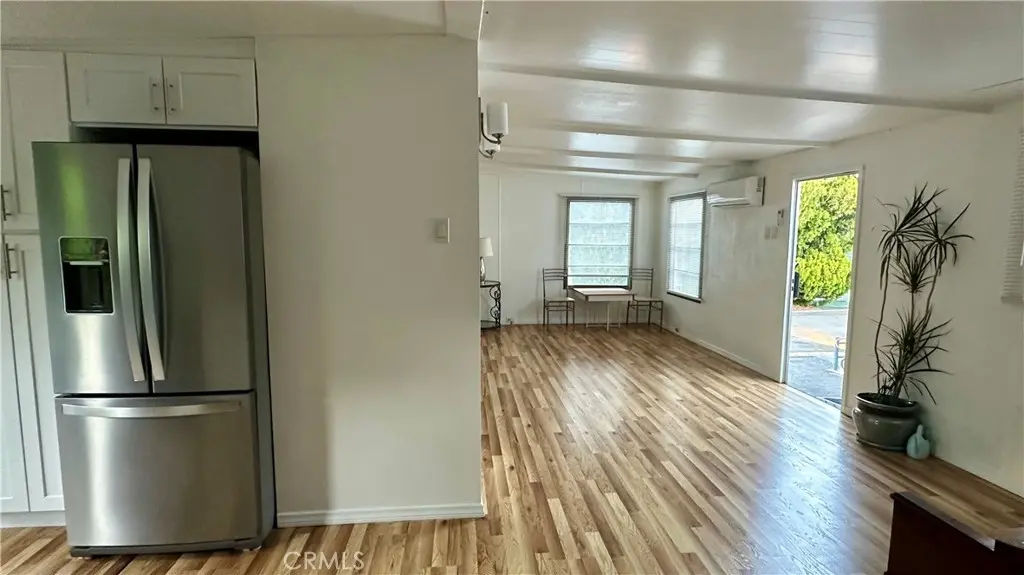
Beautifully remodeled 2BR/2 Bath mobile home in desirable 55+ community. Bright, open floor plan w/ updated kitchen, flooring, and fixtures throughout. Move-in ready! Located near hills, parks, schools, shopping, and more. Low space rent. Quiet, well-maintained park. Great opportunity for comfortable & affordable living in a convenient location.
Key facts
- Open floor plan
- Desirable community
- Updated kitchen
Tags
Neighborhood map
What this means for you Summary
Snapshot
- This is a 2-bed/1.5-bath manufactured listed at $175k. Condition is rated good.
Deal economics
- At list price, monthly cash flow is $1k ($13k/yr) — positive.
- The deal already cash-flows at list — no discount required.
- Meets the 1% rule at list price ($3k rent vs $175k).
- Recommended offer: $154k (12.0% below list) — sets the bar for market timing.
- Cap rate 14.1% vs local median 2.1% in Los Angeles — top-decile yield for the area; either an underpriced asset or a hidden risk that comps aren't pricing in. Stress-test before assuming the spread holds.
Location & tenants
- Location reads 68/100 on livability (#273 in CA) — a middle-class / working-renter tenant base. Strengths: amenities A+, commute A+, employment B; Watch: health & safety C-, schools D+, crime F.
- Los Angeles Unified (urban): math 29% / reading 54% proficiency, ranked #223 of 517 in CA (top 43%) — families likely to look elsewhere, expect single-tenant / working-renter base with shorter leases; 67% free/reduced lunch — lower-income household profile, screen leases tightly.
- Market conditions: 73 active listings in the ZIP; 40 comparable units currently listed for rent nearby; rentals at typical pace (median 23d on market — plan ~3-4 weeks tenant-placement turnaround); solid renter incomes; 19,697 units permitted in Los Angeles County in 2024 (9,426 in 5+ unit buildings).
- This rent runs 36% of the median local income ($98k/yr) — at the standard rent-burdened threshold; future hikes will face affordability resistance.
Forward outlook
- Local home prices are declining (-3.0%/yr); year-one equity from $1k of loan paydown is wiped out by about $5k of value loss. Plan a longer hold.
- Los Angeles County population projected at +9% by 2050 — modest demand growth; plan on rents tracking national, not racing it.
- At projected returns (-3.0% appreciation + 3.0% rent growth), your $49k cash investment doubles in ~5 years — after that, you're playing with house money.
Negotiation context
- It's been on market 135 days — a 12% lower offer ($154k) is reasonable based on typical stale-listing flexibility.
- 3 sale attempts since 2y ago with the ask held roughly flat each time — persistent listings suggest the price (not the market) is what's stuck; bring a comps-based counter.
- Current owner paid $76k; list at $175k implies a 130% gain — meaningful room to come down on a strong offer.
Risks & watch-outs
- Watch-outs: flood insurance adds $66/mo.
- Climate carrying-cost: major flood risk; severe wildfire risk; extreme-heat days projected 7→19/yr by 2055 (HVAC capex compounding) — expect insurance premiums to compound above CPI over the hold.
Questions for the listing agent
- It's been on market 135 days. Have you received any prior offers? Is the seller open to a 12% concession, seller financing, or rate buy-down credit?
- Built in 1963 — when were the roof, HVAC, electrical panel, plumbing, and water heater last replaced?
- What's the actual annual flood-insurance premium (NFIP or private), and is the property in a SFHA with mandatory coverage?
- Why hasn't it sold? Are there any deal-killer items the seller is aware of (foundation, flood, title, zoning, code violations)?
- Is there a deadline driving the sale (1031 exchange, divorce, estate, relocation)? That informs how much negotiation room exists.
- Schools are D-rated, which usually means shorter tenancies and higher turnover. Who's the typical renter profile here, and what's been the actual vacancy rate?
- Crime grade is F in this area — have there been break-ins, vandalism, or insurance claims at this property in the last 3 years? What carrier currently insures it and at what premium?
- What's the average days-on-market for RENTAL listings here right now (not sales)? A rising rental-DOM trend means longer vacancies and softer asking-rent achievability than the comps imply.
- What's the recent tenant-quality profile in this submarket — average credit score on applications, eviction rate, late-payment / NSF rate, and stable-employment percentage? A property-management company in the area should have these aggregated.
- How much new for-sale + rental construction is in the pipeline within 1–3 miles? Heavy new supply typically softens prices + rents 12–24 months out; constrained supply supports both.
Investment metrics
- 1% rule
- 1.70% ✓
- Cap rate
- 14.07%
- Cash-on-cash
- 27.79%
- DSCR
- 2.24
- GRM
- 4.9
CMA / ARV
- ARV (median comp)
- $135,000
- List price
- $175,000
- Delta
- 29.63%
- Verdict
- OVERPRICED
- Comps
- 1 within 2.0 mi
Show comp detail 1 sale within ~0.75 mi
| Address | Dist | Beds/Ba | Sqft | Sold | Price | $/sf | Match |
|---|---|---|---|---|---|---|---|
| 10799 Sherman Grv #76 | 0.08mi | 2/1.0 | 960 (-4%) | 12mo | $170,000 | $177 | 77 |
Match score weights: distance 35% · size 25% · config 20% · recency 20%. Top-matched comps best support the ARV.
Projected returns pro-forma
-3.0% appreciation · 3.0% rent growth · sell at horizon
- IRR
- 19.9%
- Equity multiple
- 1.81×
- Total profit
- $39,768
- Equity at exit
- $26,093
- IRR
- 28.2%
- Equity multiple
- 3.50×
- Total profit
- $122,589
- Equity at exit
- $15,131
Cash invested: $49,000 (down + closing). Projections, not guarantees.
Landlord ↔ Tenant lean methodology
- Overall (CITY)
- 0 Strongly Tenant-Friendly
- State California
- 18 Strongly Tenant-Friendly · D+13
- County
- — inherits STATE
- City Los Angeles
- 0 Strongly Tenant-Friendly · D+22
ZIP-level market 91040
- Active inventory
- 73
- Price-to-rent
- 4.9×
Monthly cashflow live
- Estimated rent
- $2,967 high interval (Pro) →
- Mortgage (P&I)
- −$918
- Tax est. 1.5%
- −$219 /mo · $2,625/yr
- Insurance
- −$73
- Flood insurance flood zone
- −$66 /mo · $798/yr
- HOA
- −$0
- Vacancy / Maint / Mgmt
- −$623
- Net cashflow
- $1,068
Break-even live
Sensitivity live
| Price | -10% $1,189 | -5% $1,129 | +0% $1,068 | +5% $1,008 | +10% $947 |
|---|---|---|---|---|---|
| Rent | -10% $834 | -5% $951 | +0% $1,068 | +5% $1,185 | +10% $1,303 |
| Rate | -1.0pp $1,156 | -0.5pp $1,113 | base $1,068 | +0.5pp $1,023 | +1.0pp $977 |
UW: 25.0% down · 7.5% · 30yr · 1.5% tax · 5.0% vac · 8.0% maint · 8.0% mgmt
Financing live
Cash to close
- Down payment
- $43,750
- Closing costs
- $5,250
- Reserves months
- —
- Total cash needed
- —
Loan-product check · same deal, 3 products live
Conventional
25% down · 7.5% · 30yr
- Down + closing
- —
- Monthly P&I
- —
- Monthly cashflow
- —
- DSCR
- —
- Eligible?
- —
Personal DTI + credit; lowest rate.
DSCR
20% down · 8.5% · 30yr
- Down + closing
- —
- Monthly P&I
- —
- Monthly cashflow
- —
- DSCR
- —
- Eligible?
- —
No personal income docs; deal must DSCR.
Hard money
10% down · 12.0% · 12mo
- Down + closing
- —
- Monthly P&I
- —
- Monthly cashflow
- —
- DSCR
- —
- Eligible?
- —
Short-term bridge; refi at stabilization.
Rent comps 40 comps
| Address | Beds | Baths | Sqft | Rent | $/sqft | DOM | Units | Dist |
|---|---|---|---|---|---|---|---|---|
| 10799 Sherman Grove Ave Sunland, CA | 1.0 | 1.0 | 900 | $2,100 | $2.33 | 44d | 1 | 0.08mi |
| 8640 Hillrose St Sunland, CA | 1.0–2.0 | 1.0–1.5 | 841 | $2,195 | $2.61 | 3d | 2 | 0.08mi |
| 8561 Kyle St Sunland, CA | 3.0 | 2.0 | 1214 | $4,100 | $3.38 | 44d | 1 | 0.12mi |
| 10500 Sherman Grove Ave Sunland, CA | 1.0–2.0 | 1.0–2.0 | 749 | $2,225 | $2.97 | 3d | 3 | 0.27mi |
| 8541 Foothill Blvd Sunland, CA | 1.0–3.0 | 1.0–2.0 | 837 | $2,472 | $2.95 | 0d | 4 | 0.30mi |
| 8421 Fenwick St Sunland, CA | 3.0 | 2.0 | 1300 | $4,680 | $3.60 | 44d | 1 | 0.30mi |
| 8608 Foothill Blvd Sunland, CA | 2.0 | 1.0–2.0 | 860 | $2,300 | $2.67 | 6d | 2 | 0.33mi |
| 10846 Scoville Ave Sunland, CA | 3.0 | 2.0 | 1320 | $3,990 | $3.02 | 8d | 1 | 0.45mi |
| 10412 Eldora Ave Sunland, CA | 3.0 | 3.0 | 1148 | $3,700 | $3.22 | 17d | 1 | 0.54mi |
| 11036 Scoville Ave Sunland, CA | 3.0 | 1.0 | 1350 | $3,800 | $2.81 | 15d | 1 | 0.57mi |
| 10351 Scoville Ave Sunland, CA | 2.0 | 2.0 | 1000 | $3,250 | $3.25 | 44d | 1 | 0.59mi |
| 10654 Nassau Ave Sunland, CA | 3.0 | 2.0 | 1419 | $4,000 | $2.82 | 44d | 1 | 0.62mi |
| 10939 Nassau Ave Sunland, CA | 3.0 | 2.0 | 1000 | $3,000 | $3.00 | 19d | 1 | 0.65mi |
| 10706 Rhodesia Ave Sunland, CA | 3.0 | 1.5 | 1161 | $3,500 | $3.01 | 0d | 1 | 0.76mi |
| 7923 Wentworth St Sunland, CA | 2.0 | 1.0 | 900 | $3,000 | $3.33 | 44d | 1 | 0.91mi |
| 7900 Kyle St Sunland, CA | 3.0 | 1.5 | 1400 | $3,600 | $2.57 | 13d | 1 | 0.92mi |
| 11021 Whitegate Ave Sunland, CA | 2.0 | 2.5 | 1000 | $2,850 | $2.85 | 44d | 1 | 0.96mi |
| 7837 Kyle St Sunland, CA | 1.0 | 1.0 | 1100 | $2,410 | $2.19 | 17d | 1 | 0.98mi |
| 7828 Kyle St Sunland, CA | 3.0 | 3.0 | 1200 | $4,500 | $3.75 | 15d | 1 | 0.99mi |
| 7826 Kyle St Sunland, CA | 3.0 | 3.0 | 1200 | $4,500 | $3.75 | 16d | 1 | 0.99mi |
| 10529 Mount Gleason Ave Sunland, CA | 3.0 | 2.0 | 1495 | $4,300 | $2.88 | 18d | 1 | 1.06mi |
| 10404 Jardine Ave Sunland, CA | 2.0 | 1.0 | 960 | $3,950 | $4.11 | 44d | 1 | 1.08mi |
| 7847 Apperson St Sunland, CA | 2.0 | 2.0 | 812 | $3,500 | $4.31 | 44d | 1 | 1.09mi |
| 10631 Tinker Ave Tujunga, CA | 3.0 | 2.0 | 968 | $3,450 | $3.56 | 23d | 1 | 1.10mi |
| 10539 Tinker Ave Tujunga, CA | 2.0 | 2.0 | 1468 | $3,600 | $2.45 | 23d | 1 | 1.11mi |
| 7767 Wyngate St Unit 101 Tujunga, CA | 2.0 | 2.0 | 1040 | $2,560 | $2.46 | 21d | 1 | 1.15mi |
| 7802 Apperson St Sunland, CA | 3.0 | 2.0 | 1200 | $3,300 | $2.75 | 25d | 1 | 1.18mi |
| 7738 Wyngate St Tujunga, CA | 2.0 | 1.0 | 900 | $3,000 | $3.33 | 25d | 1 | 1.21mi |
| 10202 Jardine Ave Sunland, CA | 2.0 | 1.0 | 800 | $2,950 | $3.69 | 44d | 1 | 1.21mi |
| 7730 Wyngate St Tujunga, CA | 2.0 | 1.0 | 900 | $3,000 | $3.33 | 25d | 1 | 1.21mi |
| 10939 Christine Way Tujunga, CA | 3.0 | 2.0 | 1000 | $3,500 | $3.50 | 44d | 1 | 1.24mi |
| 10604 Plainview Ave Tujunga, CA | 2.0 | 1.0 | 768 | $2,250 | $2.93 | 44d | 1 | 1.34mi |
| 7612 Machrea St Tujunga, CA | 1.0 | 1.0 | 900 | $2,200 | $2.44 | 16d | 1 | 1.34mi |
| 10554 Plainview Ave Tujunga, CA | 2.0 | 1.0 | 1000 | $3,500 | $3.50 | 23d | 1 | 1.35mi |
| 10509 Wilsey Ave Unit Front Hous Tujunga, CA | 2.0 | 1.0 | 920 | $3,300 | $3.59 | 25d | 1 | 1.39mi |
| 9813 Foothill Blvd Sylmar, CA | 2.0 | 1.0 | 1050 | $3,100 | $2.95 | 44d | 1 | 1.41mi |
| 10507 Helendale Ave Tujunga, CA | 2.0 | 2.0 | 860 | $3,100 | $3.60 | 44d | 1 | 1.45mi |
| 9850 Wentworth St Sunland, CA | 2.0 | 2.0 | 983 | $3,600 | $3.66 | 25d | 1 | 1.45mi |
| 10602 Helendale Ave Tujunga, CA | 3.0 | 2.0 | 1391 | $3,750 | $2.70 | 12d | 1 | 1.45mi |
| 10618 Johanna Ave Shadow Hills, CA | 1.0 | 1.0 | 800 | $2,200 | $2.75 | 20d | 1 | 1.50mi |
Listing history 21 events
-
2026-06-21days on market $175,000 Active 135 DOM
-
2026-06-18days on market $175,000 Active 132 DOM
-
2026-06-17days on market $175,000 Active 131 DOM
-
2026-06-16days on market $175,000 Active 130 DOM
-
2026-06-15days on market $175,000 Active 129 DOM
-
2026-06-13days on market $175,000 Active 127 DOM
-
2026-06-09days on market $175,000 Active 123 DOM
-
2026-06-08days on market $175,000 Active 122 DOM
-
2026-06-07days on market $175,000 Active 121 DOM
-
2026-06-04days on market $175,000 Active 118 DOM
-
2026-06-03days on market $175,000 Active 117 DOM
-
2026-06-02days on market $175,000 Active 116 DOM
-
2026-06-01days on market $175,000 Active 115 DOM
-
2026-05-31days on market $175,000 Active 114 DOM
-
2026-02-06$175,000 Active 353-char remark
Show marketing remark (353 chars)
Beautifully remodeled 2BR/2 Bath mobile home in desirable 55+ community. Bright, open floor plan w/ updated kitchen, flooring, and fixtures throughout. Move-in ready! Located near hills, parks, schools, shopping, and more. Low space rent. Quiet, well-maintained park. Great opportunity for comfortable & affordable living in a convenient location.
-
2026-02-06historical
Show marketing remark (353 chars)
Beautifully remodeled 2BR/2 Bath mobile home in desirable 55+ community. Bright, open floor plan w/ updated kitchen, flooring, and fixtures throughout. Move-in ready! Located near hills, parks, schools, shopping, and more. Low space rent. Quiet, well-maintained park. Great opportunity for comfortable & affordable living in a convenient location.
-
2025-09-12$250,000 Active
-
2024-03-29soldstatus $76,000 Closed Sale
-
2024-03-08status Pending Sale
-
2024-02-29historical Active Under Contract
-
2024-02-14$75,000 Active
ⓘ Source: listings_history table (triggers on properties + properties_extension) + one-shot
backfill from property_details.listing_events for pre-trigger history.
Climate risk First Street
- Flood 7/10 Severe FEMA zone X (unshaded) · 78% chance over 30 yrs
- Wildfire 8/10 Severe
- Heat 5/10 Major 7 d/yr ≥97°F today · 19 d/yr by 30 yrs out
- Wind 1/10 Low
- Air quality 9/10 Extreme 18 unhealthy d/yr today · 21 by 30 yrs out
Nearby sold comps map
Loading sold comps map…
Walkable amenities ~0.75 mi
Loading nearby amenities…
Taxation est. · year 1
- Rental income
- $35,607
- − Mortgage interest
- −$9,803
- − Property taxes
- −$2,625
- − Insurance
- −$1,672
- − Repairs & maintenance
- −$2,849
- − Management
- −$2,849
- − Depreciation
- −$5,091
- Taxable income
- $10,719
- Est. tax owed @ 24.0%
- −$2,573
- After-tax cash flow
- $10,247/yr
For passive investors: Depreciation is non-cash, so a rental often shows a tax loss while cash-flowing — sheltering income. Rental losses are passive: they offset passive income freely, and up to $25,000/yr can offset ordinary (W-2) income if you actively participate and your MAGI is under $100k (phasing out to $0 by $150k); unused losses carry forward. On sale, claimed depreciation is recaptured at up to 25%, and gains may owe capital-gains tax (a 1031 exchange can defer both). Figures are a year-1 estimate at your 24.0% rate — not tax advice; consult a CPA.
Condition & rehab AI · 12 photos
This remodeled mobile home is move-in ready with updated kitchen and bathrooms, and a good condition overall. It offers a great opportunity for comfortable and affordable living in a convenient location.
Value-add opportunities
- Both Paint exterior siding — Fresh paint can enhance curb appeal and property value
- Both Replace blinds with energy-efficient windows — Improved energy efficiency and better light control
- Both Install smart home devices — Enhances convenience and adds modern appeal
Renovation cost estimate screening
Value-add ROI direction
- Both Paint exterior siding — Fresh paint can enhance curb appeal and property value ↑
- Both Replace blinds with energy-efficient windows — Improved energy efficiency and better light control ↑
- Both Install smart home devices — Enhances convenience and adds modern appeal ↑
ⓘ Cost ranges are severity-bucket heuristics (US national rule-of-thumb). Get contractor quotes + a written scope before underwriting a rehab budget.
Schools (NCES district)
- District
- Los Angeles Unified
- NCES district ID
- 0622710
- Math proficiency
- 29% ▼ -4.00%
- Reading proficiency
- 54% ▲ 10.00%
- Median HH income
- $50,403
- Composite
- 35.67/100
- National rank
- #4875
- State rank
- #223 of 517 in CA
Livability — Los Angeles
- Score
- 68/100
- State rank
- #273
- US rank
- #9237
Category grades
Schools grade is shown separately in the Schools card above.
Census & demographics
- Census place
- Los Angeles, CA
- County
- Los Angeles County · 9,444,647 people
- City population
- 3,838,149
- Metro
- Los Angeles-Long Beach-Anaheim, CA
- Population (ZIP)
- 20,821
- Household income
- $98,256
- Rent vs Own
- Severe rent burden
- 866.0
Population outlook (Los Angeles County) Hauer SSP2
- Today (2025)
- 10,940,515 people
- By 2030
- 11,256,481 · +2.9%
- By 2040
- 11,729,929 · +7.2%
- By 2050
- 11,948,407 · +9.2%
- By 2075
- 11,818,114 · +8.0%
- By 2100
- 10,842,928 · -0.9%
Race, ethnicity, and origin ACS 2023
- Neighborhood character
- Diverse neighborhood (Simpson 0.57)
- Race & ethnicity
- White 61% Hispanic / Latino 22% Two or more races 16% Asian 9% Black 3%
- Hispanic origin (detail)
- Mexican 13%
- Common ancestry
- Lithuanian 2% Slovak 2% Romanian 1%
- Foreign-born
- 32% · Canada, South Korea
- Languages at home
- 55% English-only · Other Indo-European 23% Spanish 14% Tagalog/Filipino 2%
Political lean MEDSL · Los Angeles
- 2024 margin
- Solid D (+32.9) · D 64.8% · R 31.9% · Other 3.3%
- 2008→2024 swing
- -7.4pp toward R · 2008: 40.4pp · 2024: 32.9pp
- All cycles
- 2024: D+32.9 2020: D+44.2 2016: D+48.0 2012: D+40.0 2008: D+40.4
Not yet ingested
- Civics
- —
Market trends
- HPI YoY
- ▼ -794.48%
- Current HPI
- 408.964
- Rent YoY
- —
- Metro
- Los Angeles-Long Beach-Anaheim, CA
- State GDP YoY
- ▲ 3.21%
- F500 in state
- 116
Industry mix (Fortune 500 HQ in CA)
| Industry | F500 HQs | Revenue |
|---|---|---|
| Technology | 27 | $1,492B |
|
||
| Financial Services | 3 | $174B |
|
||
| Retail | 3 | $44B |
|
||
| Insurance | 3 | $26B |
|
||
| Media / Entertainment | 2 | $115B |
|
||
| Pharmaceuticals / Biotech | 2 | $62B |
|
||
Price history
+133.3% since first listed7 events — show timeline
- 2026-02-06 Listing Removed — CRMLS
- 2026-02-06 Listed $175,000 CRMLS
- 2025-09-12 Listed $250,000 CRMLS
- 2024-03-29 Sold (MLS) $76,000 CRMLS
- 2024-03-08 Pending — CRMLS
- 2024-02-29 Contingent — CRMLS
- 2024-02-14 Listed $75,000 CRMLS
Property tax history
+2.9%/yrLatest (2025): $256 · +2.9% YoY. Source: county tax records.
Cash-flow waterfall
monthlySold comps — $/sqft
last 12 mo · ≤1 miLoading sold comps…