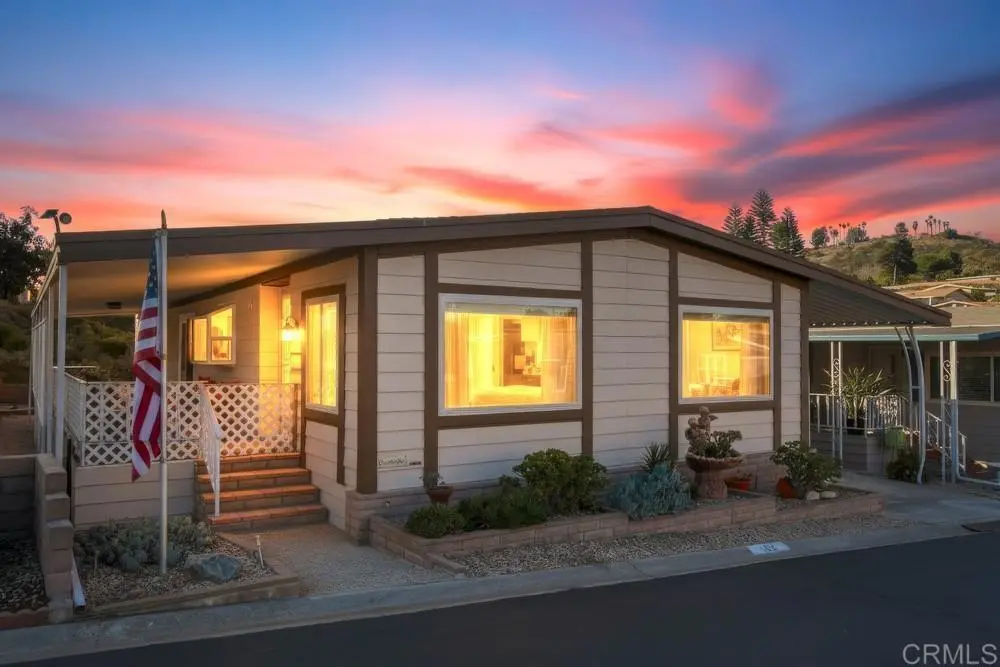
1175 La Moree Rd #52
San Marcos, CA 92078
$408,000F
2 bd · 2.0 ba ·
1,440 sqft ·
Built 1978
· Manufactured
· Active
· 30 DOM
Cashflow @ list (25.0% down · 7.5%)
Estimated rent
$3,376/mo
Mortgage (P&I)
−$2,140
Tax + insurance
−$329
HOA
−$270
Vac / Maint / Mgmt
−$709
Net cashflow
$-72/mo
Annual
$-859/yr
Cap rate
6.08%
Cash-on-cash
-0.75%
DSCR
0.97
1% rule
0.83%
Cash to close
$114,240
Investor read
- This is a 2-bed/2.0-bath manufactured listed at $408k.
- At list price, monthly cash flow is $-72 ($-859/yr) — negative.
- To cash-flow at today's rent, offer at most $395k (3.1% below list).
- To meet the 1% rule (rent ≥ 1% of price), the offer needs to be $338k (17.3% below list).
- It's been on market 30 days — a 2% lower offer ($402k) is reasonable based on typical stale-listing flexibility.
- Recommended offer: $338k (17.3% below list) — sets the bar for 1% rule.
- Local home prices are declining (-3.0%/yr); year-one equity from $3k of loan paydown is wiped out by about $12k of value loss. Plan a longer hold.
- Location reads 77/100 on livability (#80 in CA, #3,074 nationally) — a middle-class / working-renter tenant base. Strengths: amenities A+, commute A+, employment A+; Watch: health & safety D+, cost of living F.
- San Marcos Unified (suburban): math 52% / reading 67% proficiency, ranked #249 of 1,400 in CA (top 18%) — acceptable for families but not a draw, mixed tenant base, ~2y average lease.
- Zoned schools: Knob Hill Elementary (752 students, 38% FRL); Woodland Park Middle (1,183 students, 43% FRL); Mission Hills High (2,893 students, 44% FRL).
- Market conditions: Rents flat; 235 active listings in the ZIP; 18 comparable units currently listed for rent nearby; rentals at typical pace (median 15d on market — plan ~3-4 weeks tenant-placement turnaround); high-income renter base; 11,759 units permitted in San Diego County in 2024 (7,244 in 5+ unit buildings).
- San Diego County population projected at +20% by 2050 — long-run rental-demand tailwind backs the buy-and-hold thesis.
- 3 sale attempts since 14y ago with the ask held roughly flat each time — persistent listings suggest the price (not the market) is what's stuck; bring a comps-based counter.
- Current owner paid $112k; list at $408k implies a 263% gain — meaningful room to come down on a strong offer.
- Climate carrying-cost: moderate wildfire risk — expect insurance premiums to compound above CPI over the hold.
- Cap rate 6.1% vs local median 2.5% in San Marcos — top-decile yield for the area; either an underpriced asset or a hidden risk that comps aren't pricing in. Stress-test before assuming the spread holds.
- This rent runs 34% of the median local income ($120k/yr) — at the standard rent-burdened threshold; future hikes will face affordability resistance.
Questions for listing agent
- What do current leases actually rent for vs. the listed asking? Can we see a recent rent roll and the last 12 months of T-12 income?
- Built in 1978 — when were the roof, HVAC, electrical panel, plumbing, and water heater last replaced?
- What does the HOA fee cover, when was the last increase, and are there any pending special assessments or reserve-fund shortfalls?
- Is there a deadline driving the sale (1031 exchange, divorce, estate, relocation)? That informs how much negotiation room exists.
- The area grade is low — what's the realistic commute time and amenity access for the typical tenant pool here? Any planned neighborhood developments (good or bad) we should know about?
- What's the average days-on-market for RENTAL listings here right now (not sales)? A rising rental-DOM trend means longer vacancies and softer asking-rent achievability than the comps imply.
- What's the recent tenant-quality profile in this submarket — average credit score on applications, eviction rate, late-payment / NSF rate, and stable-employment percentage? A property-management company in the area should have these aggregated.
- How much new for-sale + rental construction is in the pipeline within 1–3 miles? Heavy new supply typically softens prices + rents 12–24 months out; constrained supply supports both.
CashFlowRE · CFR-7SM30CFBZ2CY5C
· Data 1 day ago
cashflowre.app · 2026-05-29