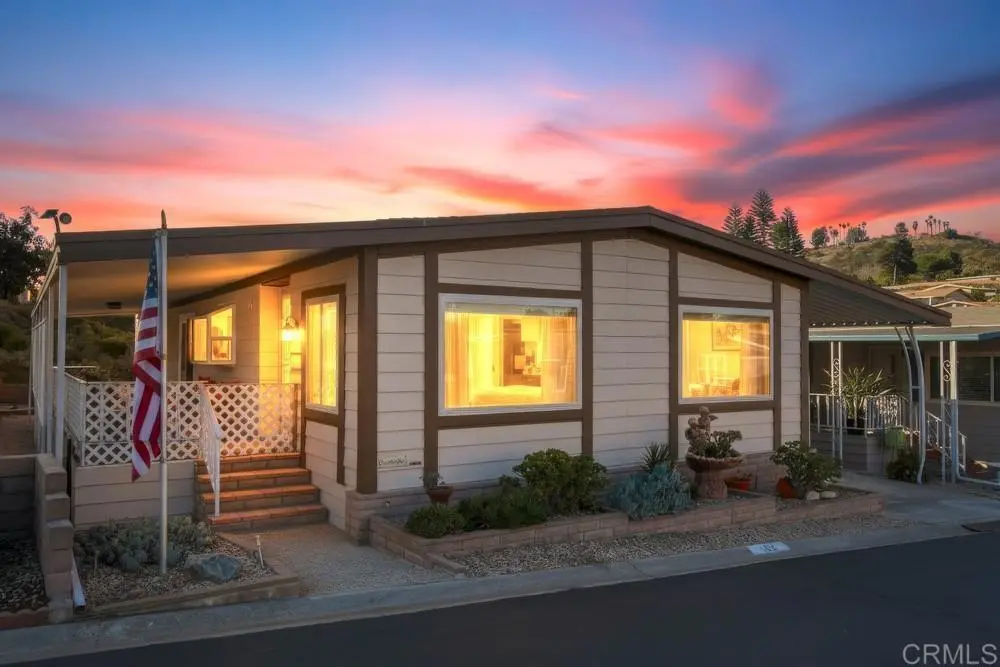
1175 La Moree Rd #52 · San Marcos, CA
Flood risk 1/10 · Minimal
- FEMA flood zone
- X (unshaded)
- Chance of flooding over 30 yrs
- 0.0%
- Est. flood insurance / yr
- $507 – $1,088
Fire risk 5/10 · Moderate
- Est. fire insurance / yr
- $659 – $1,223
Heat risk 4/10 · Minor
- Hot days now (above 98°F)
- 7 days/yr
- Hot days in 30 yrs
- 23 days/yr
Wind risk 1/10 · Minimal
- Chance of severe wind over 30 yrs
- —
Air-quality risk 4/10 · Minor
- Unhealthy air days now
- 5 days/yr
- Unhealthy air days in 30 yrs
- 5 days/yr
Risk factors via First Street. Map © Google.
Why this score? — see what drove the F grade
The composite is a weighted blend of 9 inputs, each scored 0–100. Each bar is that input's sub-score; the figure is the points it added to the 100-point composite (weight × sub-score).
- Cash flow +12.3/30.0
- Schools +5.4/10.0
- Livability +3.9/5.0
- DSCR +3.7/10.0
- 1% rule +3.3/10.0
- Rent growth +2.6/5.0
- Condition / age +2.5/5.0
- ARV discount +0.0/15.0
- Appreciation +0.0/10.0
$408,000
🖨 Deal sheet (PDF) 📄 Offer letter ✓ Due diligence
Listing remarks MLS
Own your own land! What a Buy for this updated and upgraded Home! Dual payne vinyl windows, ceramic tile floors. Large master suite and bath. Newer central heater. Upgraded oven + large cooktop! Upgraded stamped concrete. Nice location in park + is close to guest parking and RV storage area. Low HOA includes: water, trash + basic cable. Oversized coverd patio with lattice for privacy. * * One of the best buys out there!!
Key facts
- Ac replaced
- Large breezy porch
- Vaulted ceilings
Tags
Property features AI
Finance
- Other: Water softener is rented; seller will provide service company name for buyer or will remove prior to close
- Financial info: Community of 122 units; Senior community
- HOA & community: Part of La Moree Estates homeowners association; Monthly association fee; Association amenities include: clubhouse, pool, spa, banquet/meeting rooms, card/billiard room, picnic area, jogging track, dog park, bike/hiking access, recreational multipurpose room, common RV parking, trash service (call for rules; pet rules apply)
Exterior
- Parking: Attached carport with 3 spaces; Parking available
- Security: No common walls (detached style)
- Utilities: Electricity connected; Cable available
- Home design: Manufactured house; Single-story; Entry at front door; Entry level 1; Condominium (common interest); Residential manufactured zoning
- Construction: Composition roof; Pier jacks foundation; Certified 433a
- Exterior features: Covered patio/deck; Deck; Awning; Community heated pool; Shed; Landscaped lot; Cul-de-sac location; Has view
Interior
- Kitchen: Kitchen open to family room; Family kitchen with breakfast counter/bar; Gas cooking; Dishwasher; Microwave; Garbage disposal; Gas water heater
- Bedrooms: Primary bedroom on the main floor; All bedrooms on the main floor; 2 main-level bedrooms
- Flooring: Tile flooring; Laminate flooring
- Bathrooms: 2 full bathrooms; Walk-in shower; Grab bars in bathroom(s)
- Heating & cooling: Central cooling; Forced air heating; Central furnace
- Interior features: High ceilings (9 feet+); Ceiling fan; Pantry; Open floor plan; Storage space; Double-pane windows; No interior steps; 36-inch or wider halls; Doors swing inward; Two or more access exits; Disability features; Grab bars in bathroom(s); Spa (community)
- Laundry & utility: Dedicated laundry room; Gas and electric dryer hookups; Washer/dryer hookups available
Neighborhood map
What this means for you Summary
Snapshot
- This is a 2-bed/2.0-bath manufactured listed at $408k.
Deal economics
- At list price, monthly cash flow is $-72 ($-859/yr) — negative.
- To cash-flow at today's rent, offer at most $395k (3.1% below list).
- To meet the 1% rule (rent ≥ 1% of price), the offer needs to be $338k (17.3% below list).
- Recommended offer: $338k (17.3% below list) — sets the bar for 1% rule.
- Cap rate 6.1% vs local median 2.5% in San Marcos — top-decile yield for the area; either an underpriced asset or a hidden risk that comps aren't pricing in. Stress-test before assuming the spread holds.
Location & tenants
- Location reads 77/100 on livability (#80 in CA, #3,074 nationally) — a middle-class / working-renter tenant base. Strengths: amenities A+, commute A+, employment A+; Watch: health & safety D+, cost of living F.
- San Marcos Unified (suburban): math 52% / reading 67% proficiency, ranked #249 of 1,400 in CA (top 18%) — acceptable for families but not a draw, mixed tenant base, ~2y average lease.
- Zoned schools: Knob Hill Elementary (752 students, 38% FRL); Woodland Park Middle (1,183 students, 43% FRL); Mission Hills High (2,893 students, 44% FRL).
- Market conditions: Rents flat; 235 active listings in the ZIP; 18 comparable units currently listed for rent nearby; rentals at typical pace (median 15d on market — plan ~3-4 weeks tenant-placement turnaround); high-income renter base; 11,759 units permitted in San Diego County in 2024 (7,244 in 5+ unit buildings).
- This rent runs 34% of the median local income ($120k/yr) — at the standard rent-burdened threshold; future hikes will face affordability resistance.
Forward outlook
- Local home prices are declining (-3.0%/yr); year-one equity from $3k of loan paydown is wiped out by about $12k of value loss. Plan a longer hold.
- San Diego County population projected at +20% by 2050 — long-run rental-demand tailwind backs the buy-and-hold thesis.
Negotiation context
- It's been on market 30 days — a 2% lower offer ($402k) is reasonable based on typical stale-listing flexibility.
- 3 sale attempts since 14y ago with the ask held roughly flat each time — persistent listings suggest the price (not the market) is what's stuck; bring a comps-based counter.
- Current owner paid $112k; list at $408k implies a 263% gain — meaningful room to come down on a strong offer.
Risks & watch-outs
- Climate carrying-cost: moderate wildfire risk — expect insurance premiums to compound above CPI over the hold.
Questions for the listing agent
- What do current leases actually rent for vs. the listed asking? Can we see a recent rent roll and the last 12 months of T-12 income?
- Built in 1978 — when were the roof, HVAC, electrical panel, plumbing, and water heater last replaced?
- What does the HOA fee cover, when was the last increase, and are there any pending special assessments or reserve-fund shortfalls?
- Is there a deadline driving the sale (1031 exchange, divorce, estate, relocation)? That informs how much negotiation room exists.
- The area grade is low — what's the realistic commute time and amenity access for the typical tenant pool here? Any planned neighborhood developments (good or bad) we should know about?
- What's the average days-on-market for RENTAL listings here right now (not sales)? A rising rental-DOM trend means longer vacancies and softer asking-rent achievability than the comps imply.
- What's the recent tenant-quality profile in this submarket — average credit score on applications, eviction rate, late-payment / NSF rate, and stable-employment percentage? A property-management company in the area should have these aggregated.
- How much new for-sale + rental construction is in the pipeline within 1–3 miles? Heavy new supply typically softens prices + rents 12–24 months out; constrained supply supports both.
Investment metrics
- 1% rule
- 0.83% ✗
- Cap rate
- 6.08%
- Cash-on-cash
- -0.75%
- DSCR
- 0.97
- GRM
- 10.1
CMA / ARV
- ARV (on-the-fly)
- $331,200
- Comps found
- 12
Show comp detail 12 sales within ~0.75 mi
| Address | Dist | Beds/Ba | Sqft | Sold | Price | $/sf | Match |
|---|---|---|---|---|---|---|---|
| 1175 La Moree Rd #24 | 0.00mi | 2/2.0 | 1,440 (0%) | 2mo | $411,000 | $285 | 98 |
| 1195 La Moree Rd #69 | 0.13mi | 2/2.0 | 1,440 (0%) | 0mo | $370,000 | $257 | 94 |
| 1195 La Moree #36 | 0.13mi | 2/2.0 | 1,456 (+1%) | 2mo | $318,700 | $219 | 90 |
| 1145 E Barham Dr #132 | 0.30mi | 2/2.0 | 1,440 (0%) | 1mo | $199,000 | $138 | 85 |
| 1145 E Barham Dr #15 | 0.30mi | 2/2.0 | 1,440 (0%) | 2mo | $299,000 | $208 | 85 |
| 1195 La Moree #98 | 0.13mi | 3/2.0 (+1) | 1,488 (+3%) | 2mo | $430,000 | $289 | 82 |
| 1145 E Barham Dr #204 | 0.34mi | 2/2.0 | 1,440 (0%) | 6mo | $329,000 | $228 | 80 |
| 1175 La Moree Rd Spc 76 | 0.00mi | 2/2.0 | 1,611 (+12%) | 3mo | $370,000 | $230 | 78 |
| 1175 La Moree Rd Spc 19 | 0.00mi | 2/2.0 | 1,248 (-13%) | 2mo | $361,000 | $289 | 76 |
| 1195 La Moree #46 | 0.13mi | 2/2.0 | 1,584 (+10%) | 6mo | $400,000 | $253 | 72 |
| 1145 E Barham Dr #48 | 0.30mi | 3/2.0 (+1) | 1,344 (-7%) | 4mo | $270,000 | $201 | 67 |
| 1145 E Barham #100 | 0.30mi | 2/2.0 | 1,655 (+15%) | 1mo | $265,000 | $160 | 60 |
Match score weights: distance 35% · size 25% · config 20% · recency 20%. Top-matched comps best support the ARV.
Projected returns pro-forma
-3.0% appreciation · 0.35% rent growth · sell at horizon
- IRR
- -20.5%
- Equity multiple
- 0.30×
- Total profit
- $-79,442
- Equity at exit
- $60,834
- IRR
- -20.7%
- Equity multiple
- 0.04×
- Total profit
- $-109,168
- Equity at exit
- $35,276
Cash invested: $114,240 (down + closing). Projections, not guarantees.
Landlord ↔ Tenant lean methodology
- Overall (STATE)
- 18 Strongly Tenant-Friendly
- State California
- 18 Strongly Tenant-Friendly · D+13
- County
- — inherits STATE
- City
- — inherits STATE
ZIP-level market 92078
- Rents YoY
- 0.3%
- Active inventory
- 235
- Price-to-rent
- 10.1×
Monthly cashflow live
- Estimated rent
- $3,376 high interval (Pro) →
- Mortgage (P&I)
- −$2,140
- Tax from tax record
- −$159 /mo · $1,905/yr
- Insurance
- −$170
- HOA
- −$270
- Vacancy / Maint / Mgmt
- −$709
- Net cashflow
- $-72
Break-even live
Sensitivity live
| Price | -10% $159 | -5% $44 | +0% $-72 | +5% $-187 | +10% $-303 |
|---|---|---|---|---|---|
| Rent | -10% $-338 | -5% $-205 | +0% $-72 | +5% $62 | +10% $195 |
| Rate | -1.0pp $134 | -0.5pp $32 | base $-72 | +0.5pp $-177 | +1.0pp $-285 |
UW: 25.0% down · 7.5% · 30yr · 1.5% tax · 5.0% vac · 8.0% maint · 8.0% mgmt
Financing live
Cash to close
- Down payment
- $102,000
- Closing costs
- $12,240
- Reserves months
- —
- Total cash needed
- —
Loan-product check · same deal, 3 products live
Conventional
25% down · 7.5% · 30yr
- Down + closing
- —
- Monthly P&I
- —
- Monthly cashflow
- —
- DSCR
- —
- Eligible?
- —
Personal DTI + credit; lowest rate.
DSCR
20% down · 8.5% · 30yr
- Down + closing
- —
- Monthly P&I
- —
- Monthly cashflow
- —
- DSCR
- —
- Eligible?
- —
No personal income docs; deal must DSCR.
Hard money
10% down · 12.0% · 12mo
- Down + closing
- —
- Monthly P&I
- —
- Monthly cashflow
- —
- DSCR
- —
- Eligible?
- —
Short-term bridge; refi at stabilization.
Rent comps 18 comps
| Address | Beds | Baths | Sqft | Rent | $/sqft | DOM | Units | Dist |
|---|---|---|---|---|---|---|---|---|
| 1134 Adele Ln San Marcos, CA | 1.0 | 2.0 | 1800 | $1,500 | $0.83 | 19d | 1 | 0.23mi |
| 1238 Sunrise Vw #104 San Marcos, CA | 3.0 | 4.0 | 1858 | $4,200 | $2.26 | 45d | 1 | 0.26mi |
| 1231 Sunrise Vw #104 San Marcos, CA | 3.0 | 3.5 | 1858 | $3,945 | $2.12 | 45d | 1 | 0.28mi |
| 131 Avenida Chapala #105 San Marcos, CA | 3.0 | 2.5 | 1379 | $3,425 | $2.48 | 3d | 1 | 0.64mi |
| 131 Avenida Chapala #105 San Marcos, CA | 3.0 | 2.5 | 1379 | $3,425 | $2.48 | 1d | 1 | 0.64mi |
| 1113 Privet St San Marcos, CA | 2.0 | 2.0 | 1008 | $2,595 | $2.57 | 26d | 1 | 0.75mi |
| 852 Avenida Ricardo San Marcos, CA | 1.0–2.0 | 1.0–2.0 | 784 | $2,724 | $3.47 | 0d | 12 | 0.94mi |
| 218 Woodland Pkwy #146 San Marcos, CA | 2.0 | 2.0 | 908 | $2,900 | $3.19 | 45d | 1 | 0.97mi |
| 506 E Barham Dr San Marcos, CA | 1.0–2.0 | 1.0–2.0 | 770 | $3,095 | $4.02 | 18d | 4 | 0.99mi |
| 570 E Barham Dr San Marcos, CA | 1.0–3.0 | 1.0–2.0 | 840 | $2,966 | $3.53 | 0d | 16 | 1.00mi |
| 823 Nordahl Rd San Marcos, CA | 1.0–3.0 | 1.0–2.0 | 887 | $2,818 | $3.18 | 1d | 1 | 1.01mi |
| 506 E Barham Dr Unit 230 San Marcos, CA | 2.0 | 2.0 | 900 | $3,095 | $3.44 | 5d | 1 | 1.02mi |
| 506 E Barham Dr Unit 224 San Marcos, CA | 2.0 | 2.0 | 900 | $2,895 | $3.22 | 4d | 1 | 1.02mi |
| 506 E Barham Dr Unit 130 San Marcos, CA | 2.0 | 2.0 | 900 | $2,975 | $3.31 | 4d | 1 | 1.02mi |
| 1898 Matin Cir #189 San Marcos, CA | 2.0 | 2.0 | 1001 | $3,195 | $3.19 | 45d | 1 | 1.16mi |
| 452 Lynwood Ln San Marcos, CA | 3.0 | 2.0 | 1000 | $3,250 | $3.25 | 45d | 1 | 1.20mi |
| 1412 Pine Heights Way San Marcos, CA | 2.0 | 2.0 | 1100 | $2,900 | $2.64 | 14d | 1 | 1.22mi |
| 250 N City Dr San Marcos, CA | 3.0 | 1.0–3.0 | 882 | $3,729 | $4.23 | 0d | 22 | 1.48mi |
HOA detail
- Monthly dues
- $270 · $3,240/yr
- Likely covers
- watertrashcable
Listing history 26 events
-
2026-06-21days on market $408,000 Active 30 DOM
-
2026-06-18days on market $408,000 Active 27 DOM
-
2026-06-17days on market $408,000 Active 26 DOM
-
2026-06-16days on market $408,000 Active 25 DOM
-
2026-06-15days on market $408,000 Active 24 DOM
-
2026-06-13days on market $408,000 Active 22 DOM
-
2026-06-09days on market $408,000 Active 18 DOM
-
2026-06-08days on market $408,000 Active 17 DOM
-
2026-06-07days on market $408,000 Active 16 DOM
-
2026-06-04days on market $408,000 Active 13 DOM
-
2026-06-03days on market $408,000 Active 12 DOM
-
2026-06-02days on market $408,000 Active 11 DOM
-
2026-06-01days on market $408,000 Active 10 DOM
-
2026-05-31days on market $408,000 Active 9 DOM
-
2026-05-23$408,000 Active
-
2026-05-05status Pending Sale 2085-char remark
-
2026-04-03historical Active Under Contract 2085-char remark
-
2026-03-06price $399,800 2085-char remark
-
2026-02-19price $414,800 2085-char remark
-
2025-11-06$419,800 Active 2085-char remark
-
2012-12-07soldstatus $112,500 426-char remark
Show marketing remark (426 chars)
Own your own land! What a Buy for this updated and upgraded Home! Dual payne vinyl windows, ceramic tile floors. Large master suite and bath. Newer central heater. Upgraded oven + large cooktop! Upgraded stamped concrete. Nice location in park + is close to guest parking and RV storage area. Low HOA includes: water, trash + basic cable. Oversized coverd patio with lattice for privacy. * * One of the best buys out there!!
-
2012-12-07soldstatus $112,500
Show marketing remark (426 chars)
Own your own land! What a Buy for this updated and upgraded Home! Dual payne vinyl windows, ceramic tile floors. Large master suite and bath. Newer central heater. Upgraded oven + large cooktop! Upgraded stamped concrete. Nice location in park + is close to guest parking and RV storage area. Low HOA includes: water, trash + basic cable. Oversized coverd patio with lattice for privacy. * * One of the best buys out there!!
-
2012-10-19$119,900 426-char remark
Show marketing remark (426 chars)
Own your own land! What a Buy for this updated and upgraded Home! Dual payne vinyl windows, ceramic tile floors. Large master suite and bath. Newer central heater. Upgraded oven + large cooktop! Upgraded stamped concrete. Nice location in park + is close to guest parking and RV storage area. Low HOA includes: water, trash + basic cable. Oversized coverd patio with lattice for privacy. * * One of the best buys out there!!
-
2002-05-13soldstatus $140,000
-
1997-04-11soldstatus $69,500
-
1994-11-01soldstatus $46,500
ⓘ Source: listings_history table (triggers on properties + properties_extension) + one-shot
backfill from property_details.listing_events for pre-trigger history.
Tax reassessment forecast CA · Resets to sale price
- Current annual tax
- $1,905 · $159/mo
- Projected year-2 tax
- $3,101 · $258/mo
- Expected delta
- +$1,196/yr (+$100/mo · 62.8%)
ⓘ Screening estimate from a state-policy table — verify with the county assessor before closing.
Climate risk First Street
- Flood 1/10 Low FEMA zone X (unshaded) · 0% chance over 30 yrs
- Wildfire 5/10 Major
- Heat 4/10 Moderate 7 d/yr ≥98°F today · 23 d/yr by 30 yrs out
- Wind 1/10 Low
- Air quality 4/10 Moderate 5 unhealthy d/yr today · 5 by 30 yrs out
Nearby sold comps map
Loading sold comps map…
Walkable amenities ~0.75 mi
Loading nearby amenities…
Taxation est. · year 1
- Rental income
- $40,507
- − Mortgage interest
- −$22,854
- − Property taxes
- −$1,905
- − Insurance
- −$2,040
- − Repairs & maintenance
- −$3,241
- − Management
- −$3,241
- − HOA
- −$3,240
- − Depreciation
- −$11,869
- Taxable loss
- −$7,882
- Est. tax savings @ 24.0%
- +$1,892
- After-tax cash flow
- $1,032/yr
For passive investors: Depreciation is non-cash, so a rental often shows a tax loss while cash-flowing — sheltering income. Rental losses are passive: they offset passive income freely, and up to $25,000/yr can offset ordinary (W-2) income if you actively participate and your MAGI is under $100k (phasing out to $0 by $150k); unused losses carry forward. On sale, claimed depreciation is recaptured at up to 25%, and gains may owe capital-gains tax (a 1031 exchange can defer both). Figures are a year-1 estimate at your 24.0% rate — not tax advice; consult a CPA.
Schools (NCES district)
- District
- San Marcos Unified
- NCES district ID
- 0634880
- Math proficiency
- 52% ▲ 1.00%
- Reading proficiency
- 67% ▲ 2.00%
- Median HH income
- $64,752
- Composite
- 53.67/100
- National rank
- #3093
- State rank
- #249 of 1400 in CA
Livability — San Marcos
- Score
- 77/100
- State rank
- #80
- US rank
- #3074
Category grades
Schools grade is shown separately in the Schools card above.
Census & demographics
- Census place
- San Marcos, CA
- County
- San Diego County · 3,178,799 people
- City population
- 100,940
- Metro
- San Diego-Chula Vista-Carlsbad, CA
- Population (ZIP)
- 53,605
- Household income
- $120,268
- Rent vs Own
- Severe rent burden
- 1594.0
Population outlook (San Diego County) Hauer SSP2
- Today (2025)
- 3,678,185 people
- By 2030
- 3,856,546 · +4.8%
- By 2040
- 4,171,407 · +13.4%
- By 2050
- 4,421,607 · +20.2%
- By 2075
- 4,831,599 · +31.4%
- By 2100
- 4,832,502 · +31.4%
Race, ethnicity, and origin ACS 2023
- Neighborhood character
- Diverse neighborhood (Simpson 0.62)
- Race & ethnicity
- White 53% Hispanic / Latino 28% Two or more races 17% Asian 10% Black 1%
- Hispanic origin (detail)
- Mexican 23%
- Common ancestry
- Italian 3% Slovak 3% Romanian 2%
- Foreign-born
- 19% · Canada, China, Vietnam
- Languages at home
- 73% English-only · Spanish 18% Other Indo-European 3% Chinese 1%
Political lean MEDSL · San Diego
- 2024 margin
- D (+16.8) · D 56.9% · R 40.1% · Other 2.9%
- 2008→2024 swing
- +6.6pp toward D · 2008: 10.2pp · 2024: 16.8pp
- All cycles
- 2024: D+16.8 2020: D+22.8 2016: D+17.8 2012: D+5.1 2008: D+10.2
Not yet ingested
- Civics
- —
Market trends
- HPI YoY
- ▼ -351.55%
- Current HPI
- 358.3294
- Rent YoY
- ▲ 0.35%
- Metro
- San Diego-Chula Vista-Carlsbad, CA
- State GDP YoY
- ▲ 3.21%
- F500 in state
- 116
Industry mix (Fortune 500 HQ in CA)
| Industry | F500 HQs | Revenue |
|---|---|---|
| Technology | 27 | $1,492B |
|
||
| Financial Services | 3 | $174B |
|
||
| Retail | 3 | $44B |
|
||
| Insurance | 3 | $26B |
|
||
| Media / Entertainment | 2 | $115B |
|
||
| Pharmaceuticals / Biotech | 2 | $62B |
|
||
Price history
+777.4% since first listed13 events — show timeline
- 2026-05-23 Listed $408,000 CRMLS
- 2026-05-05 Pending — CRMLS
- 2026-04-03 Contingent — CRMLS
- 2026-03-28 Listing Removed — CRMLS
- 2026-03-06 Price Changed $399,800 CRMLS
- 2026-02-19 Price Changed $414,800 CRMLS
- 2025-11-06 Listed $419,800 CRMLS
- 2012-12-07 Sold (Public Records) $112,500 Public Records
- 2012-12-07 Sold (MLS) $112,500 CRMLS
- 2012-10-19 Listed $119,900 CRMLS
- 2002-05-13 Sold (Public Records) $140,000 Public Records
- 1997-04-11 Sold (Public Records) $69,500 Public Records
- 1994-11-01 Sold (Public Records) $46,500 Public Records
Property tax history
+6.6%/yrLatest (2025): $1,905 · +4.5% YoY. Source: county tax records.
Cash-flow waterfall
monthlySold comps — $/sqft
last 12 mo · ≤1 miLoading sold comps…