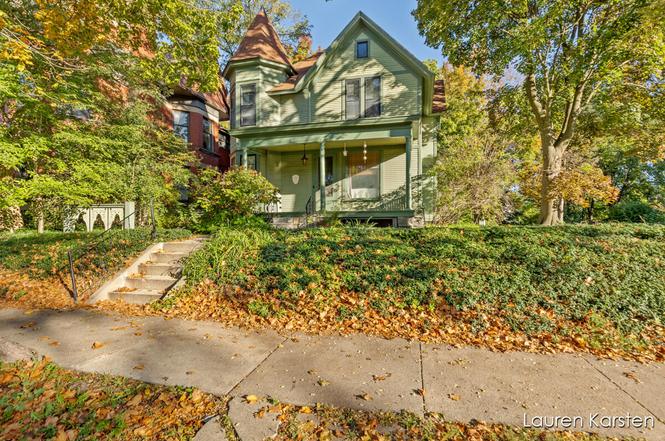
623 Cherry St SE
Grand Rapids, MI 49503
$689,900D+
25 bd · 25.0 ba ·
— sqft ·
Built 1875
· MultiFamily
· Active
· 2 DOM
Cashflow @ list (25.0% down · 7.5%)
Estimated rent
$6,998/mo
Mortgage (P&I)
−$3,618
Tax + insurance
−$1,150
HOA
−$0
Vac / Maint / Mgmt
−$1,470
Net cashflow
$761/mo
Annual
$9,128/yr
Cap rate
7.62%
Cash-on-cash
4.73%
DSCR
1.21
1% rule
1.01%
Cash to close
$193,172
Investor read
- This is a 5 × 1-bed/1.0-bath units multifamily listed at $690k.
- At list price, monthly cash flow is $761 ($9k/yr) — positive. Per door: $152/mo.
- The deal already cash-flows at list — no discount required.
- Meets the 1% rule at list price ($7k rent vs $690k).
- Only 2 days on market — expect competitive offers; lowballing is unlikely to land.
- Local home prices are declining (-3.0%/yr); year-one equity from $5k of loan paydown is wiped out by about $21k of value loss. Plan a longer hold.
- Location reads 83/100 on livability (#44 in MI, #939 nationally) — a professional / high-income tenant draw. Strengths: amenities A+, commute A+, cost of living A+; Watch: employment C-, crime F.
- Grand Rapids Public Schools (urban): math 15% / reading 29% proficiency, ranked #451 of 540 in MI (top 84%) — low school quality limits family demand, transient renter base, plan for 1-2y turnover; 80% free/reduced lunch — lower-income household profile, screen leases tightly.
- Watch-outs: built in 1875 — expect roof / HVAC / electrical / plumbing capex.
- Market conditions: Rents rising (+2.8%/yr); 181 active listings in the ZIP; 2,253 units permitted in Kent County in 2024 (969 in 5+ unit buildings).
- Kent County population projected at +22% by 2050 — long-run rental-demand tailwind backs the buy-and-hold thesis.
- 10 sale attempts since 38y ago with the ask held roughly flat each time — persistent listings suggest the price (not the market) is what's stuck; bring a comps-based counter.
- Current owner paid $170k; list at $690k implies a 306% gain — meaningful room to come down on a strong offer.
- Cap rate 7.6% vs local median 4.5% in Grand Rapids — top-decile yield for the area; either an underpriced asset or a hidden risk that comps aren't pricing in. Stress-test before assuming the spread holds.
- At $6,998/mo this rent would consume 130% of the median local household income ($65k/yr) (locally 1891% of renters already pay >50% of income on rent) — very limited rent-growth headroom before tenants either downsize or default.
Questions for listing agent
- Can we see the unit-by-unit rent roll, current vacancy, and any below-market leases? What's the average tenancy length?
- What capital expenditures (roof, boiler, parking lot, exteriors) have been made in the last 5 years, and what's planned in the next 2?
- Built in 1875 — when were the roof, HVAC, electrical panel, plumbing, and water heater last replaced?
- Is there a deadline driving the sale (1031 exchange, divorce, estate, relocation)? That informs how much negotiation room exists.
- Crime grade is F in this area — have there been break-ins, vandalism, or insurance claims at this property in the last 3 years? What carrier currently insures it and at what premium?
- The area grade is low — what's the realistic commute time and amenity access for the typical tenant pool here? Any planned neighborhood developments (good or bad) we should know about?
- What's the average days-on-market for RENTAL listings here right now (not sales)? A rising rental-DOM trend means longer vacancies and softer asking-rent achievability than the comps imply.
- What's the recent tenant-quality profile in this submarket — average credit score on applications, eviction rate, late-payment / NSF rate, and stable-employment percentage? A property-management company in the area should have these aggregated.
CashFlowRE · CFR-7TSCE58ENHFNBQ
· Data 2 days ago
cashflowre.app · 2026-05-29