 5-Plex
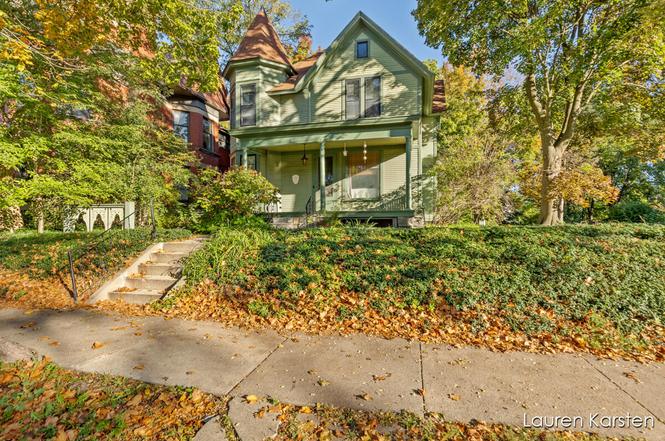
623 Cherry St SE · Grand Rapids, MI
Flood risk No data
- FEMA flood zone
- —
- Chance of flooding over 30 yrs
- —
- Est. flood insurance / yr
- —
Fire risk No data
- Est. fire insurance / yr
- —
Heat risk No data
- Hot days now (above threshold)
- —
- Hot days in 30 yrs
- —
Wind risk No data
- Chance of severe wind over 30 yrs
- —
Air-quality risk No data
- Unhealthy air days now
- —
- Unhealthy air days in 30 yrs
- —
Risk factors via First Street. Map © Google.
Why this score? — see what drove the D+ grade
The composite is a weighted blend of 9 inputs, each scored 0–100. Each bar is that input's sub-score; the figure is the points it added to the 100-point composite (weight × sub-score).
- Cash flow +19.3/30.0
- ARV discount +7.5/15.0
- DSCR +6.1/10.0
- 1% rule +5.1/10.0
- Livability +4.2/5.0
- Rent growth +3.2/5.0
- Condition / age +2.5/5.0
- Schools +1.9/10.0
- Appreciation +0.0/10.0
$689,900
🖨 Deal sheet 📄 Offer letter ✓ Due diligence
Multi-family units
County records classify this as Multi-Family (5+ Unit). Listing-text estimate: 5 units. confirmed
5+ unit building — per-unit beds/baths from public records are typically unavailable; the breakdown below (if shown) is an estimate from the listing text.
Listing remarks MLS
Great investment opportunity with this Cherry Hill 5 unit property! All units are 1 bedroom/1 bathroom and bringing in a total of 6,985/month in rent. The property also offers amble off street parking! Conveniently located to Medical Mile, downtown Grand Rapids, shopping, nightlife, local coffee shops, and restaurants. Call today to set up a showing and add to your investment portfolio!
Key facts
- Off street parking
- Medical mile
- 0.39 acre lot
Tags
Property features AI
Finance
- Financial info: Rents listed by unit: $1,395, $1,425, $1,195, $1,375, $1,425 (unit-specific rents provided)
Exterior
- Parking: Total of 4 parking spaces
- Utilities: Public water; Public sewer; Electricity connected; Natural gas connected
- Home design: Residential income property (multi-family)
- Construction: Wood siding exterior
- Exterior features: Lot dimensions approximately 64 x 264; Lot area about 0.39 acres (16,901 sq ft); Zoned residential
Interior
- Kitchen: Kitchens in each unit (appliance details not provided)
- Bedrooms: Multiple 1-bedroom units (five separate 1-bedroom units)
- Bathrooms: Each unit has 1 bathroom
- Heating & cooling: Forced air heating powered by natural gas
- Interior features: Basement present; Has forced air heating (natural gas)
- Laundry & utility: Utilities include electricity and natural gas
Neighborhood map
What this means for you Summary
Snapshot
- This is a 5 × 1-bed/1.0-bath units multifamily listed at $690k.
Deal economics
- At list price, monthly cash flow is $761 ($9k/yr) — positive. Per door: $152/mo.
- The deal already cash-flows at list — no discount required.
- Meets the 1% rule at list price ($7k rent vs $690k).
- Cap rate 7.6% vs local median 4.5% in Grand Rapids — top-decile yield for the area; either an underpriced asset or a hidden risk that comps aren't pricing in. Stress-test before assuming the spread holds.
Location & tenants
- Location reads 83/100 on livability (#44 in MI, #939 nationally) — a professional / high-income tenant draw. Strengths: amenities A+, commute A+, cost of living A+; Watch: employment C-, crime F.
- Grand Rapids Public Schools (urban): math 15% / reading 29% proficiency, ranked #451 of 540 in MI (top 84%) — low school quality limits family demand, transient renter base, plan for 1-2y turnover; 80% free/reduced lunch — lower-income household profile, screen leases tightly.
- Market conditions: Rents rising (+2.8%/yr); 181 active listings in the ZIP; 2,253 units permitted in Kent County in 2024 (969 in 5+ unit buildings).
- At $6,998/mo this rent would consume 130% of the median local household income ($65k/yr) (locally 1891% of renters already pay >50% of income on rent) — very limited rent-growth headroom before tenants either downsize or default.
Forward outlook
- Local home prices are declining (-3.0%/yr); year-one equity from $5k of loan paydown is wiped out by about $21k of value loss. Plan a longer hold.
- Kent County population projected at +22% by 2050 — long-run rental-demand tailwind backs the buy-and-hold thesis.
Negotiation context
- Only 2 days on market — expect competitive offers; lowballing is unlikely to land.
- 10 sale attempts since 38y ago with the ask held roughly flat each time — persistent listings suggest the price (not the market) is what's stuck; bring a comps-based counter.
- Current owner paid $170k; list at $690k implies a 306% gain — meaningful room to come down on a strong offer.
Risks & watch-outs
- Watch-outs: built in 1875 — expect roof / HVAC / electrical / plumbing capex.
Questions for the listing agent
- Can we see the unit-by-unit rent roll, current vacancy, and any below-market leases? What's the average tenancy length?
- What capital expenditures (roof, boiler, parking lot, exteriors) have been made in the last 5 years, and what's planned in the next 2?
- Built in 1875 — when were the roof, HVAC, electrical panel, plumbing, and water heater last replaced?
- Is there a deadline driving the sale (1031 exchange, divorce, estate, relocation)? That informs how much negotiation room exists.
- Crime grade is F in this area — have there been break-ins, vandalism, or insurance claims at this property in the last 3 years? What carrier currently insures it and at what premium?
- The area grade is low — what's the realistic commute time and amenity access for the typical tenant pool here? Any planned neighborhood developments (good or bad) we should know about?
- What's the average days-on-market for RENTAL listings here right now (not sales)? A rising rental-DOM trend means longer vacancies and softer asking-rent achievability than the comps imply.
- What's the recent tenant-quality profile in this submarket — average credit score on applications, eviction rate, late-payment / NSF rate, and stable-employment percentage? A property-management company in the area should have these aggregated.
- How much new apartment / multifamily construction is in the pipeline within 1–3 miles? Heavy new supply (>2% of stock underway) typically softens rents 12–24 months out; light construction supports rent growth.
Investment metrics
- 1% rule
- 1.01% ✓
- Cap rate
- 7.62%
- Cash-on-cash
- 4.73%
- DSCR
- 1.21
- GRM
- 8.2
CMA / ARV
No comps found within radius.
Projected returns pro-forma
-3.0% appreciation · 2.82% rent growth · sell at horizon
- IRR
- -9.1%
- Equity multiple
- 0.67×
- Total profit
- $-64,505
- Equity at exit
- $102,866
- IRR
- 0.1%
- Equity multiple
- 1.01×
- Total profit
- $1,471
- Equity at exit
- $59,650
Cash invested: $193,172 (down + closing). Projections, not guarantees.
Landlord ↔ Tenant lean methodology
- Overall (STATE)
- 62 Landlord-Friendly
- State Michigan
- 62 Landlord-Friendly · EVEN
- County
- — inherits STATE
- City
- — inherits STATE
ZIP-level market 49503
- Rents YoY
- 2.8%
- Active inventory
- 181
- Price-to-rent
- 41.1×
Monthly cashflow live
- Estimated rent
- $6,998 high interval (Pro) →
- Mortgage (P&I)
- −$3,618
- Tax est. 1.5%
- −$862 /mo · $10,348/yr
- Insurance
- −$287
- HOA
- −$0
- Vacancy / Maint / Mgmt
- −$1,470
- Net cashflow
- $761
Break-even live
5-unit breakdown (identical units grouped — click to expand)
| Units | Beds | Baths | Est. rent |
|---|---|---|---|
| 5× units | 1 | 1 | $7,000 |
| #1 | 1 | 1 | $1,400 |
| #2 | 1 | 1 | $1,400 |
| #3 | 1 | 1 | $1,400 |
| #4 | 1 | 1 | $1,400 |
| #5 | 1 | 1 | $1,400 |
| Total (5 units) | $6,998 | ||
UW: 25.0% down · 7.5% · 30yr · 1.5% tax · 5.0% vac · 8.0% maint · 8.0% mgmt
Financing live
Cash to close
- Down payment
- $172,475
- Closing costs
- $20,697
- Reserves months
- —
- Total cash needed
- —
Loan-product check · same deal, 3 products live
Conventional
25% down · 7.5% · 30yr
- Down + closing
- —
- Monthly P&I
- —
- Monthly cashflow
- —
- DSCR
- —
- Eligible?
- —
Personal DTI + credit; lowest rate.
DSCR
20% down · 8.5% · 30yr
- Down + closing
- —
- Monthly P&I
- —
- Monthly cashflow
- —
- DSCR
- —
- Eligible?
- —
No personal income docs; deal must DSCR.
Hard money
10% down · 12.0% · 12mo
- Down + closing
- —
- Monthly P&I
- —
- Monthly cashflow
- —
- DSCR
- —
- Eligible?
- —
Short-term bridge; refi at stabilization.
Listing history 3 events
-
2026-06-18days on market $689,900 Active 2 DOM
-
2026-06-16remarks 389-char remark
-
2026-06-16$689,900 Active 1 DOM
ⓘ Source: listings_history table (triggers on properties + properties_extension) + one-shot
backfill from property_details.listing_events for pre-trigger history.
Nearby sold comps map
Loading sold comps map…
Walkable amenities ~0.75 mi
Loading nearby amenities…
Taxation est. · year 1
- Rental income
- $83,976
- − Mortgage interest
- −$38,645
- − Property taxes
- −$10,348
- − Insurance
- −$3,450
- − Repairs & maintenance
- −$6,718
- − Management
- −$6,718
- − Depreciation
- −$20,070
- Taxable loss
- −$1,973
- Est. tax savings @ 24.0%
- +$474
- After-tax cash flow
- $9,602/yr
For passive investors: Depreciation is non-cash, so a rental often shows a tax loss while cash-flowing — sheltering income. Rental losses are passive: they offset passive income freely, and up to $25,000/yr can offset ordinary (W-2) income if you actively participate and your MAGI is under $100k (phasing out to $0 by $150k); unused losses carry forward. On sale, claimed depreciation is recaptured at up to 25%, and gains may owe capital-gains tax (a 1031 exchange can defer both). Figures are a year-1 estimate at your 24.0% rate — not tax advice; consult a CPA.
Schools (NCES district)
- District
- Grand Rapids Public Schools
- NCES district ID
- 2616440
- Math proficiency
- 15% ▼ -5.00%
- Reading proficiency
- 29% ▼ -1.00%
- Median HH income
- $40,612
- Composite
- 18.62/100
- National rank
- #8899
- State rank
- #451 of 540 in MI
Livability — Grand Rapids
- Score
- 83/100
- State rank
- #44
- US rank
- #939
Category grades
Schools grade is shown separately in the Schools card above.
Census & demographics
- Census place
- Grand Rapids, MI
- County
- Kent County · 533,805 people
- City population
- 181,325
- Metro
- Grand Rapids-Kentwood, MI
- Population (ZIP)
- 39,489
- Household income
- $64,661
- Rent vs Own
- Severe rent burden
- 1891.0
Population outlook (Kent County) Hauer SSP2
- Today (2025)
- 712,484 people
- By 2030
- 748,618 · +5.1%
- By 2040
- 814,777 · +14.4%
- By 2050
- 868,556 · +21.9%
- By 2075
- 966,487 · +35.7%
- By 2100
- 967,975 · +35.9%
Race, ethnicity, and origin ACS 2023
- Neighborhood character
- Diverse neighborhood (Simpson 0.60)
- Race & ethnicity
- White 59% Hispanic / Latino 19% Two or more races 14% Black 14% Asian 3%
- Hispanic origin (detail)
- Mexican 11% Puerto Rican 1%
- Common ancestry
- Iranian 10% Romanian 7% Slovak 2%
- Foreign-born
- 11% · Canada, South Korea, China
- Languages at home
- 82% English-only · Spanish 15% Chinese 1%
Political lean MEDSL · Kent
- 2024 margin
- Lean D (+5.4) · D 51.8% · R 46.5% · Other 1.7%
- 2008→2024 swing
- +4.8pp toward D · 2008: 0.5pp · 2024: 5.4pp
- All cycles
- 2024: D+5.4 2020: D+6.1 2016: R+3.1 2012: R+7.9 2008: D+0.5
Not yet ingested
- Civics
- —
Market trends
- HPI YoY
- ▼ -347.22%
- Current HPI
- 312.3878
- Rent YoY
- ▲ 2.82%
- Metro
- Grand Rapids-Kentwood, MI
- State GDP YoY
- ▲ 1.37%
- F500 in state
- 28
Industry mix (Fortune 500 HQ in MI)
| Industry | F500 HQs | Revenue |
|---|---|---|
| Automotive Parts | 3 | $48B |
|
||
| Automotive | 2 | $372B |
|
||
| Chemicals | 1 | $45B |
|
||
| Automotive Retail | 1 | $29B |
|
||
| Healthcare / Medical Devices | 1 | $23B |
|
||
| Automotive Technology | 1 | $20B |
|
||
Price history
+961.4% since first listed20 events — show timeline
- 2026-06-16 Listed $689,900 REALCOMP
- 2026-06-15 Listed $689,900 MiRealSource-MiMLS
- 2025-11-05 Pending — REALCOMP
- 2025-11-05 Pending — MiRealSource-MiMLS
- 2025-11-04 Listing Removed — MiRealSource-MiMLS
- 2025-11-04 Listing Removed — REALCOMP
- 2025-10-14 Listed $689,900 MiRealSource-MiMLS
- 2025-10-14 Listed $689,900 REALCOMP
- 2015-02-12 Listing Removed — SW Michigan MLS
- 2015-02-12 Listing Removed — SW Michigan MLS
- 2015-02-12 Listing Removed — SW Michigan MLS
- 2011-12-22 Sold (MLS) $170,000 REALCOMP
- 2011-12-22 Sold (MLS) $170,000 SW Michigan MLS
- 2011-10-23 Listed $174,900 REALCOMP
- 2011-10-23 Listed $174,900 SW Michigan MLS
- 1995-11-07 Sold (MLS) $99,000 SW Michigan MLS
- 1995-04-28 Listed $109,900 SW Michigan MLS
- 1989-07-17 Listed $64,900 SW Michigan MLS
- 1989-02-23 Listed $65,000 SW Michigan MLS
- 1988-09-09 Listed $65,000 SW Michigan MLS
Cash-flow waterfall
monthlySold comps — $/sqft
last 12 mo · ≤1 miLoading sold comps…