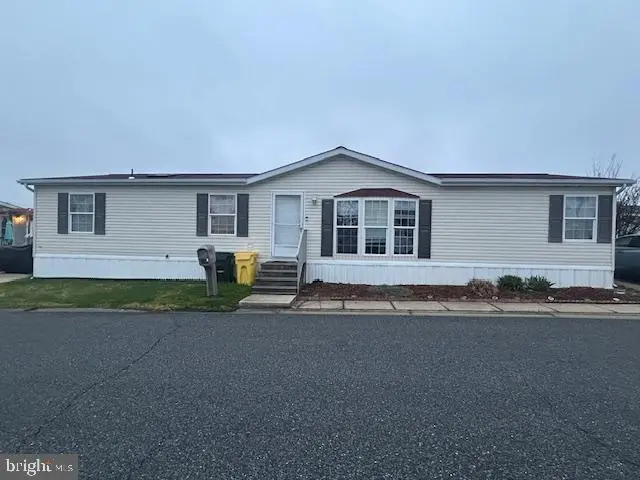
3202 Foxglove Ln
Middle River, MD 21220
$89,500B-
3 bd · 2.0 ba ·
1,700 sqft ·
Built 2003
· SingleFamily
· Active
· 8 DOM
Cashflow @ list (25.0% down · 7.5%)
Estimated rent
$2,466/mo
Mortgage (P&I)
−$469
Tax + insurance
−$149
HOA
−$0
Vac / Maint / Mgmt
−$518
Net cashflow
$1,330/mo
Annual
$15,958/yr
Cap rate
24.12%
Cash-on-cash
63.68%
DSCR
3.83
1% rule
2.76%
Cash to close
$25,060
Investor read
- This is a 3-bed/2.0-bath single-family listed at $90k. Condition is rated average.
- At list price, monthly cash flow is $1k ($16k/yr) — positive.
- The deal already cash-flows at list — no discount required.
- Meets the 1% rule at list price ($2k rent vs $90k).
- Only 8 days on market — expect competitive offers; lowballing is unlikely to land.
- Local home prices are declining (-3.0%/yr); year-one equity from $619 of loan paydown is wiped out by about $3k of value loss. Plan a longer hold.
- Location reads 78/100 on livability (#76 in MD, #2,777 nationally) — a middle-class / working-renter tenant base. Strengths: commute A+, housing A+, health & safety A+; Watch: crime F.
- Baltimore County Public Schools (suburban): math 15% / reading 34% proficiency, ranked #11 of 24 in MD (top 46%) — low school quality limits family demand, transient renter base, plan for 1-2y turnover.
- Zoned schools: Glenmar Elementary (math 12% / reading 22%, grade F, #408 of 860 statewide, top 50%, 278 students, 57% FRL); Middle River Middle (math 5% / reading 32%, grade F, #159 of 225 statewide, top 73%, 978 students, 62% FRL) — zoned schools average 59% FRL vs 39% district-wide (21 pts higher); higher-poverty schools than district average — tighter screening recommended.
- Market conditions: Rents flat; 251 active listings in the ZIP; 8 comparable units currently listed for rent nearby; rentals lingering (median 44d on market — plan ~5-8 weeks vacancy on turnover, expect pricing pressure); 50% of comp listings sitting > 30 days — soft ceiling on asking rent; solid renter incomes; 1,511 units permitted in Baltimore County in 2024 (643 in 5+ unit buildings).
- Baltimore County population projected at +12% by 2050 — modest demand growth; plan on rents tracking national, not racing it.
- At projected returns (-3.0% appreciation + 0.8% rent growth), your $25k cash investment doubles in ~2 years — after that, you're playing with house money.
- Cap rate 24.1% vs local median 4.1% in Middle River — top-decile yield for the area; either an underpriced asset or a hidden risk that comps aren't pricing in. Stress-test before assuming the spread holds.
- This rent runs 36% of the median local income ($82k/yr) — at the standard rent-burdened threshold; future hikes will face affordability resistance.
Questions for listing agent
- Is there a deadline driving the sale (1031 exchange, divorce, estate, relocation)? That informs how much negotiation room exists.
- Schools are F-rated, which usually means shorter tenancies and higher turnover. Who's the typical renter profile here, and what's been the actual vacancy rate?
- Crime grade is F in this area — have there been break-ins, vandalism, or insurance claims at this property in the last 3 years? What carrier currently insures it and at what premium?
- What's the average days-on-market for RENTAL listings here right now (not sales)? A rising rental-DOM trend means longer vacancies and softer asking-rent achievability than the comps imply.
- What's the recent tenant-quality profile in this submarket — average credit score on applications, eviction rate, late-payment / NSF rate, and stable-employment percentage? A property-management company in the area should have these aggregated.
- How much new for-sale + rental construction is in the pipeline within 1–3 miles? Heavy new supply typically softens prices + rents 12–24 months out; constrained supply supports both.
Repairs flagged (vision-AI assessment)
- Minor: Kitchen cabinets — Worn appearance suggests some wear and tear.
- Minor: Kitchen countertops — Dated appearance suggests they could be replaced.
- Minor: Landscaping — Basic landscaping could be improved with some updates.
CashFlowRE · CFR-7V0W9Q4HTVFKAH
· Data 2 days ago
cashflowre.app · 2026-05-29