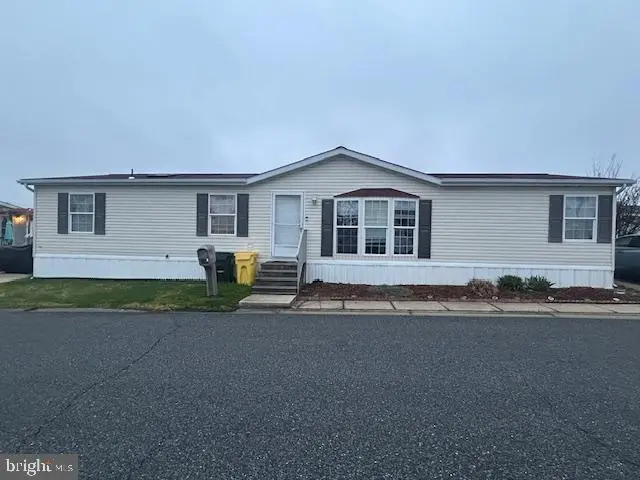
3202 Foxglove Ln · Middle River, MD
Flood risk No data
- FEMA flood zone
- —
- Chance of flooding over 30 yrs
- —
- Est. flood insurance / yr
- —
Fire risk No data
- Est. fire insurance / yr
- —
Heat risk No data
- Hot days now (above threshold)
- —
- Hot days in 30 yrs
- —
Wind risk No data
- Chance of severe wind over 30 yrs
- —
Air-quality risk No data
- Unhealthy air days now
- —
- Unhealthy air days in 30 yrs
- —
Risk factors via First Street. Map © Google.
Why this score? — see what drove the B- grade
The composite is a weighted blend of 9 inputs, each scored 0–100. Each bar is that input's sub-score; the figure is the points it added to the 100-point composite (weight × sub-score).
- Cash flow +30.0/30.0
- 1% rule +10.0/10.0
- DSCR +10.0/10.0
- ARV discount +7.5/15.0
- Livability +3.9/5.0
- Condition / age +2.8/5.0
- Rent growth +2.7/5.0
- Schools +2.3/10.0
- Appreciation +0.0/10.0
$89,500
🖨 Deal sheet 📄 Offer letter ✓ Due diligence
Listing remarks
Welcome to this well-maintained 3-bedroom, 2-bath manufactured home located in the highly desirable Peppermint Woods community. This home offers a comfortable and functional layout, perfect for everyday living. The kitchen features ample cabinet storage and generous counter space, providing plenty of room for meal preparation and organization. The open design allows for easy flow into the main living areas. The primary suite includes a spacious en suite bathroom, offering privacy and comfort. Two additional bedrooms provide flexibility for guests, family, or a home office. A large wrap around deck with ramp and access to the rear yard. Key Features: 3 Bedrooms | 2 Full Bathrooms Located in
Key facts
- 2 parking spots
- Built 2003
- Listed 7 days
Property features AI
Finance
- Other: No stairs (accessibility feature); Pets allowed with breed restrictions
- Financial info: Monthly land lease $1,133 (land lease years remaining: 0); Total actual rent reported: $13,596
- HOA & community: Monthly community/other fee of $30.96; Property manager present; Park names: Williams Estates and Peppermint Woods
Exterior
- Parking: Driveway parking (2 spaces); Total of 2 garage/parking spaces
- Utilities: Public water; Public sewer; Electric heating, cooling and hot water
- Home design: Manufactured double-wide; Land lease ownership; Not in a federal flood zone; Property in good condition
- Construction: Aluminum siding; Asphalt roof; Building not winterized; Estimated year built
- Exterior features: Front yard; Side yards; Shed; Above grade other structures
Interior
- Kitchen: Refrigerator; Electric oven/range; Microwave
- Bedrooms: 3 bedrooms on main level
- Flooring: Carpet
- Bathrooms: 2 full bathrooms (both on main level)
- Heating & cooling: Electric baseboard heating; Central air conditioning (electric)
- Interior features: Paneled walls; Partially furnished; Has fireplace (1)
- Laundry & utility: Washer and dryer on main floor; Electric water heater
Neighborhood map
What this means for you Summary
Snapshot
- This is a 3-bed/2.0-bath single-family listed at $90k. Condition is rated average.
Deal economics
- At list price, monthly cash flow is $1k ($16k/yr) — positive.
- The deal already cash-flows at list — no discount required.
- Meets the 1% rule at list price ($2k rent vs $90k).
- Cap rate 24.1% vs local median 4.1% in Middle River — top-decile yield for the area; either an underpriced asset or a hidden risk that comps aren't pricing in. Stress-test before assuming the spread holds.
Location & tenants
- Location reads 78/100 on livability (#76 in MD, #2,777 nationally) — a middle-class / working-renter tenant base. Strengths: commute A+, housing A+, health & safety A+; Watch: crime F.
- Baltimore County Public Schools (suburban): math 15% / reading 34% proficiency, ranked #11 of 24 in MD (top 46%) — low school quality limits family demand, transient renter base, plan for 1-2y turnover.
- Zoned schools: Glenmar Elementary (math 12% / reading 22%, grade F, #408 of 860 statewide, top 50%, 278 students, 57% FRL); Middle River Middle (math 5% / reading 32%, grade F, #159 of 225 statewide, top 73%, 978 students, 62% FRL) — zoned schools average 59% FRL vs 39% district-wide (21 pts higher); higher-poverty schools than district average — tighter screening recommended.
- Market conditions: Rents flat; 251 active listings in the ZIP; 8 comparable units currently listed for rent nearby; rentals lingering (median 44d on market — plan ~5-8 weeks vacancy on turnover, expect pricing pressure); 50% of comp listings sitting > 30 days — soft ceiling on asking rent; solid renter incomes; 1,511 units permitted in Baltimore County in 2024 (643 in 5+ unit buildings).
- This rent runs 36% of the median local income ($82k/yr) — at the standard rent-burdened threshold; future hikes will face affordability resistance.
Forward outlook
- Local home prices are declining (-3.0%/yr); year-one equity from $619 of loan paydown is wiped out by about $3k of value loss. Plan a longer hold.
- Baltimore County population projected at +12% by 2050 — modest demand growth; plan on rents tracking national, not racing it.
- At projected returns (-3.0% appreciation + 0.8% rent growth), your $25k cash investment doubles in ~2 years — after that, you're playing with house money.
Negotiation context
- Only 8 days on market — expect competitive offers; lowballing is unlikely to land.
Questions for the listing agent
- Is there a deadline driving the sale (1031 exchange, divorce, estate, relocation)? That informs how much negotiation room exists.
- Schools are F-rated, which usually means shorter tenancies and higher turnover. Who's the typical renter profile here, and what's been the actual vacancy rate?
- Crime grade is F in this area — have there been break-ins, vandalism, or insurance claims at this property in the last 3 years? What carrier currently insures it and at what premium?
- What's the average days-on-market for RENTAL listings here right now (not sales)? A rising rental-DOM trend means longer vacancies and softer asking-rent achievability than the comps imply.
- What's the recent tenant-quality profile in this submarket — average credit score on applications, eviction rate, late-payment / NSF rate, and stable-employment percentage? A property-management company in the area should have these aggregated.
- How much new for-sale + rental construction is in the pipeline within 1–3 miles? Heavy new supply typically softens prices + rents 12–24 months out; constrained supply supports both.
Investment metrics
- 1% rule
- 2.76% ✓
- Cap rate
- 24.12%
- Cash-on-cash
- 63.68%
- DSCR
- 3.83
- GRM
- 3.0
CMA / ARV
- ARV (on-the-fly)
- $353,600
- Comps found
- 3
Show comp detail 3 sales within ~0.75 mi
| Address | Dist | Beds/Ba | Sqft | Sold | Price | $/sf | Match |
|---|---|---|---|---|---|---|---|
| 3204 Jonquil Ln | 0.09mi | 3/2.0 | 1,900 (+12%) | 8mo | $110,000 | $58 | 70 |
| 11513 Eastern Ave | 0.63mi | 4/1.5 (+1) | 1,635 (-4%) | 4mo | $340,000 | $208 | 54 |
| 9 Creek Side Ct | 0.38mi | 3/3.0 | 1,900 (+12%) | 15mo | $435,000 | $229 | 47 |
Match score weights: distance 35% · size 25% · config 20% · recency 20%. Top-matched comps best support the ARV.
Projected returns pro-forma
-3.0% appreciation · 0.83% rent growth · sell at horizon
- IRR
- 60.3%
- Equity multiple
- 3.59×
- Total profit
- $64,962
- Equity at exit
- $13,345
- IRR
- 64.2%
- Equity multiple
- 6.79×
- Total profit
- $145,074
- Equity at exit
- $7,738
Cash invested: $25,060 (down + closing). Projections, not guarantees.
Landlord ↔ Tenant lean methodology
- Overall (STATE)
- 27 Tenant-Leaning
- State Maryland
- 27 Tenant-Leaning · D+14
- County
- — inherits STATE
- City
- — inherits STATE
ZIP-level market 21220
- Rents YoY
- 0.8%
- Active inventory
- 251
- Price-to-rent
- 3.0×
Monthly cashflow live
- Estimated rent
- $2,466 high interval (Pro) →
- Mortgage (P&I)
- −$469
- Tax est. 1.5%
- −$112 /mo · $1,342/yr
- Insurance
- −$37
- HOA
- −$0
- Vacancy / Maint / Mgmt
- −$518
- Net cashflow
- $1,330
Break-even live
UW: 25.0% down · 7.5% · 30yr · 1.5% tax · 5.0% vac · 8.0% maint · 8.0% mgmt
Financing live
Cash to close
- Down payment
- $22,375
- Closing costs
- $2,685
- Reserves months
- —
- Total cash needed
- —
Loan-product check · same deal, 3 products live
Conventional
25% down · 7.5% · 30yr
- Down + closing
- —
- Monthly P&I
- —
- Monthly cashflow
- —
- DSCR
- —
- Eligible?
- —
Personal DTI + credit; lowest rate.
DSCR
20% down · 8.5% · 30yr
- Down + closing
- —
- Monthly P&I
- —
- Monthly cashflow
- —
- DSCR
- —
- Eligible?
- —
No personal income docs; deal must DSCR.
Hard money
10% down · 12.0% · 12mo
- Down + closing
- —
- Monthly P&I
- —
- Monthly cashflow
- —
- DSCR
- —
- Eligible?
- —
Short-term bridge; refi at stabilization.
Rent comps 8 comps
| Address | Beds | Baths | Sqft | Rent | $/sqft | DOM | Units | Dist |
|---|---|---|---|---|---|---|---|---|
| 11550 Crossroads Cir Middle River, MD | 1.0–2.0 | 1.0–2.0 | 893 | $2,849 | $3.19 | 2d | 15 | 1.19mi |
| 1 Alder Dr Middle River, MD | 1.0–3.0 | 1.0 | 1000 | $2,249 | $2.25 | 5d | 10 | 1.19mi |
| 520 Holly Hunt Rd Middle River, MD | 4.0 | 3.0 | 1508 | $2,300 | $1.53 | 43d | 1 | 1.20mi |
| 985 Morgan Run Rd Middle River, MD | 4.0 | 3.5 | 2200 | $3,100 | $1.41 | 43d | 1 | 1.23mi |
| 10018 Sandy Run Rd Middle River, MD | 4.0 | 2.5 | 1970 | $3,050 | $1.55 | 43d | 1 | 1.32mi |
| 1006 Windlass Glen Rd Middle River, MD | 3.0 | 4.0 | 1940 | $3,150 | $1.62 | 43d | 1 | 1.36mi |
| 3924 Cutty Sark Rd Middle River, MD | 2.0 | 1.5 | 1180 | $1,699 | $1.44 | 24d | 1 | 1.44mi |
| 37 Alberge Ln Middle River, MD | 2.0–3.0 | 1.0–2.0 | 928 | $2,052 | $2.21 | 1d | 8 | 1.49mi |
Listing history 9 events
-
2026-06-18days on market $89,500 Active 8 DOM
-
2026-06-17days on market $89,500 Active 7 DOM
-
2026-06-16days on market $89,500 Active 6 DOM
-
2026-06-15days on market $89,500 Active 5 DOM
-
2026-06-13statusdays on market $89,500 Active 3 DOM
-
2026-06-09days on market $89,500 Coming Soon 4 DOM
-
2026-06-08days on market $89,500 Coming Soon 3 DOM
-
2026-06-07remarks 699-char remark
-
2026-06-07$89,500 Coming Soon 2 DOM
ⓘ Source: listings_history table (triggers on properties + properties_extension) + one-shot
backfill from property_details.listing_events for pre-trigger history.
Nearby sold comps map
Loading sold comps map…
Walkable amenities ~0.75 mi
Loading nearby amenities…
Taxation est. · year 1
- Rental income
- $29,595
- − Mortgage interest
- −$5,013
- − Property taxes
- −$1,342
- − Insurance
- −$448
- − Repairs & maintenance
- −$2,368
- − Management
- −$2,368
- − Depreciation
- −$2,604
- Taxable income
- $15,453
- Est. tax owed @ 24.0%
- −$3,709
- After-tax cash flow
- $12,249/yr
For passive investors: Depreciation is non-cash, so a rental often shows a tax loss while cash-flowing — sheltering income. Rental losses are passive: they offset passive income freely, and up to $25,000/yr can offset ordinary (W-2) income if you actively participate and your MAGI is under $100k (phasing out to $0 by $150k); unused losses carry forward. On sale, claimed depreciation is recaptured at up to 25%, and gains may owe capital-gains tax (a 1031 exchange can defer both). Figures are a year-1 estimate at your 24.0% rate — not tax advice; consult a CPA.
Condition & rehab AI · 14 photos
This home is in average condition with some cosmetic updates needed to enhance its resale and rental value.
Repairs flagged
- Minor Kitchen cabinets — Worn appearance suggests some wear and tear.
- Minor Kitchen countertops — Dated appearance suggests they could be replaced.
- Minor Landscaping — Basic landscaping could be improved with some updates.
Value-add opportunities
- Resale Paint interior walls — Fresh paint can make a significant difference in the home's appeal.
- Resale Replace kitchen countertops — Modern countertops can enhance the kitchen's functionality and aesthetic.
- Both Landscaping improvements — Enhanced landscaping can improve curb appeal and add value.
Renovation cost estimate screening
| Repair item | Severity | Est. cost |
|---|---|---|
| Kitchen cabinets · Worn appearance suggests some wear and tear. | Minor | $500–3,000 |
| Kitchen countertops · Dated appearance suggests they could be replaced. | Minor | $500–3,000 |
| Landscaping · Basic landscaping could be improved with some updates. | Minor | $500–3,000 |
| Total estimated repair cost · 3 items | $1,500–9,000 |
Value-add ROI direction
- Resale Paint interior walls — Fresh paint can make a significant difference in the home's appeal. ↑
- Resale Replace kitchen countertops — Modern countertops can enhance the kitchen's functionality and aesthetic. ↑
- Both Landscaping improvements — Enhanced landscaping can improve curb appeal and add value. ↑
ⓘ Cost ranges are severity-bucket heuristics (US national rule-of-thumb). Get contractor quotes + a written scope before underwriting a rehab budget.
Schools (NCES district)
- District
- Baltimore County Public Schools
- NCES district ID
- 2400120
- Math proficiency
- 15% ▼ -16.00%
- Reading proficiency
- 34% ▼ -5.00%
- Median HH income
- $66,746
- Composite
- 23.17/100
- National rank
- #7948
- State rank
- #11 of 24 in MD
Livability — Middle River
- Score
- 78/100
- State rank
- #76
- US rank
- #2777
Category grades
Schools grade is shown separately in the Schools card above.
Census & demographics
- Census place
- Middle River, MD
- County
- Baltimore County · 769,527 people
- City population
- 42,824
- Metro
- Baltimore-Columbia-Towson, MD
- Population (ZIP)
- 42,824
- Household income
- $81,817
- Rent vs Own
- Severe rent burden
- 1921.0
Population outlook (Baltimore County) Hauer SSP2
- Today (2025)
- 885,518 people
- By 2030
- 909,272 · +2.7%
- By 2040
- 951,547 · +7.5%
- By 2050
- 990,955 · +11.9%
- By 2075
- 1,086,411 · +22.7%
- By 2100
- 1,135,078 · +28.2%
Race, ethnicity, and origin ACS 2023
- Neighborhood character
- Diverse neighborhood (Simpson 0.60)
- Race & ethnicity
- White 57% Black 27% Two or more races 6% Hispanic / Latino 6% Asian 5%
- Hispanic origin (detail)
- Puerto Rican 1%
- Common ancestry
- Romanian 4% Ukrainian 2% Lithuanian 1%
- Foreign-born
- 12% · Canada, Vietnam
- Languages at home
- 86% English-only · Spanish 3% Arabic 3% Tagalog/Filipino 2%
Political lean MEDSL · Baltimore
- 2024 margin
- Strong D (+24.5) · D 61.0% · R 36.5% · Other 2.5%
- 2008→2024 swing
- +9.9pp toward D · 2008: 14.6pp · 2024: 24.5pp
- All cycles
- 2024: D+24.5 2020: D+27.0 2016: D+17.4 2012: D+16.4 2008: D+14.6
Not yet ingested
- Civics
- —
Market trends
- HPI YoY
- ▼ -199.31%
- Current HPI
- 254.5597
- Rent YoY
- ▲ 0.83%
- Metro
- Baltimore-Columbia-Towson, MD
- State GDP YoY
- ▲ 2.97%
- F500 in state
- 12
Industry mix (Fortune 500 HQ in MD)
| Industry | F500 HQs | Revenue |
|---|---|---|
| Aerospace / Defense | 1 | $71B |
|
||
| Utilities | 1 | $25B |
|
||
| Hotels | 1 | $24B |
|
||
| Consumer Goods | 1 | $7B |
|
||
| Real Estate | 1 | $6B |
|
||
| Chemicals | 1 | $2B |
|
||
Price history
-99.9% since first listed2 events — show timeline
- 2026-06-05 Price Changed $89,500 BRIGHT MLS
- 2026-06-05 Coming Soon $89,500,000 BRIGHT MLS
Cash-flow waterfall
monthlySold comps — $/sqft
last 12 mo · ≤1 miLoading sold comps…