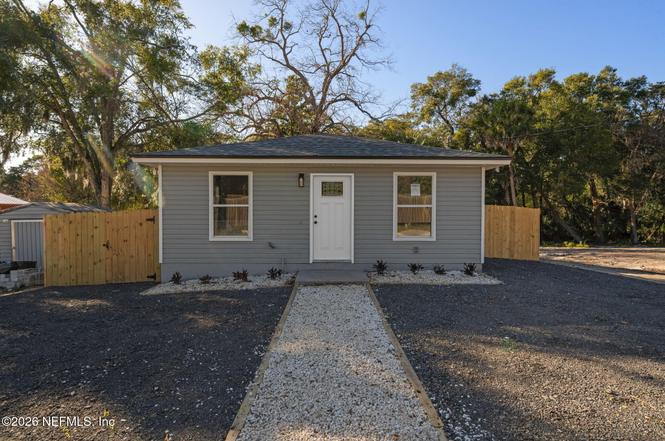
533 S Rodriquez St
St. Augustine, FL 32084
$249,000C
3 bd · 2.0 ba ·
1,000 sqft ·
Built 2007
· SingleFamily
· Pending
· 105 DOM
Cashflow @ list (25.0% down · 7.5%)
Estimated rent
$2,404/mo
Mortgage (P&I)
−$1,306
Tax + insurance
−$203
HOA
−$0
Vac / Maint / Mgmt
−$505
Net cashflow
$390/mo
Annual
$4,680/yr
Cap rate
8.17%
Cash-on-cash
6.71%
DSCR
1.30
1% rule
0.97%
Cash to close
$69,720
Investor read
- This is a 3-bed/2.0-bath single-family listed at $249k.
- At list price, monthly cash flow is $390 ($5k/yr) — positive.
- The deal already cash-flows at list — no discount required.
- To meet the 1% rule (rent ≥ 1% of price), the offer needs to be $240k (3.5% below list).
- It's been on market 105 days — a 9% lower offer ($227k) is reasonable based on typical stale-listing flexibility.
- Recommended offer: $227k (9.0% below list) — sets the bar for market timing.
- Local home prices are declining (-3.0%/yr); year-one equity from $2k of loan paydown is wiped out by about $7k of value loss. Plan a longer hold.
- Location reads: area grade C — affects rentability + tenant quality, not the cash-flow math above.
- St. Johns (rural): math 75% / reading 73% proficiency, ranked #2 of 73 in FL (top 3%) — strong family-tenant draw, lease renewals of 3-5y typical; only 20% free/reduced lunch — higher-income household profile.
- Zoned schools: Osceola Elementary School (math 63% / reading 57%, grade B-, #680 of 2,144 statewide, top 32%, 703 students, 64% FRL); R J Murray Middle School (math 54% / reading 54%, grade B-, #196 of 571 statewide, top 36%, 695 students, 50% FRL); St. Augustine High School (math 54% / reading 62%, grade C, #120 of 667 statewide, top 18%, 1,784 students, 38% FRL) — zoned schools average 50% FRL vs 20% district-wide (31 pts higher); higher-poverty schools than district average — tighter screening recommended.
- Zoned-school proficiency averages 57% at this address vs 74% district-wide (-17 pts) — the specific schools serving this property underperform the St. Johns average; the district grade overstates school quality for this exact location.
- Market conditions: Rents flat; 636 active listings in the ZIP; 40 comparable units currently listed for rent nearby; rentals at typical pace (median 16d on market — plan ~3-4 weeks tenant-placement turnaround); 5,575 units permitted in St. Johns County in 2024 (584 in 5+ unit buildings).
- St. Johns County population projected at +60% by 2050 — long-run rental-demand tailwind backs the buy-and-hold thesis.
- 2 sale attempts; this cycle's ask has dropped $26k (9%) from the opening price — seller is motivated, your offer sets the floor, not the list.
- Current owner paid $185k; 35% above their basis — modest negotiation headroom, anchor on the comps not their cost.
- Climate carrying-cost: severe wind risk, 99% chance of damaging wind over 30y; moderate wildfire risk; extreme-heat days projected 7→20/yr by 2055 (HVAC capex compounding) — expect insurance premiums to compound above CPI over the hold.
- Cap rate 8.2% vs local median 3.1% in St. Augustine — top-decile yield for the area; either an underpriced asset or a hidden risk that comps aren't pricing in. Stress-test before assuming the spread holds.
- This rent runs 39% of the median local income ($74k/yr) — at the standard rent-burdened threshold; future hikes will face affordability resistance.
Questions for listing agent
- It's been on market 105 days. Have you received any prior offers? Is the seller open to a 9% concession, seller financing, or rate buy-down credit?
- Why hasn't it sold? Are there any deal-killer items the seller is aware of (foundation, flood, title, zoning, code violations)?
- Is there a deadline driving the sale (1031 exchange, divorce, estate, relocation)? That informs how much negotiation room exists.
- What's the average days-on-market for RENTAL listings here right now (not sales)? A rising rental-DOM trend means longer vacancies and softer asking-rent achievability than the comps imply.
- What's the recent tenant-quality profile in this submarket — average credit score on applications, eviction rate, late-payment / NSF rate, and stable-employment percentage? A property-management company in the area should have these aggregated.
- How much new for-sale + rental construction is in the pipeline within 1–3 miles? Heavy new supply typically softens prices + rents 12–24 months out; constrained supply supports both.
CashFlowRE · CFR-7Y6QB251B6E5WB
· Data 4 weeks ago
cashflowre.app · 2026-05-29