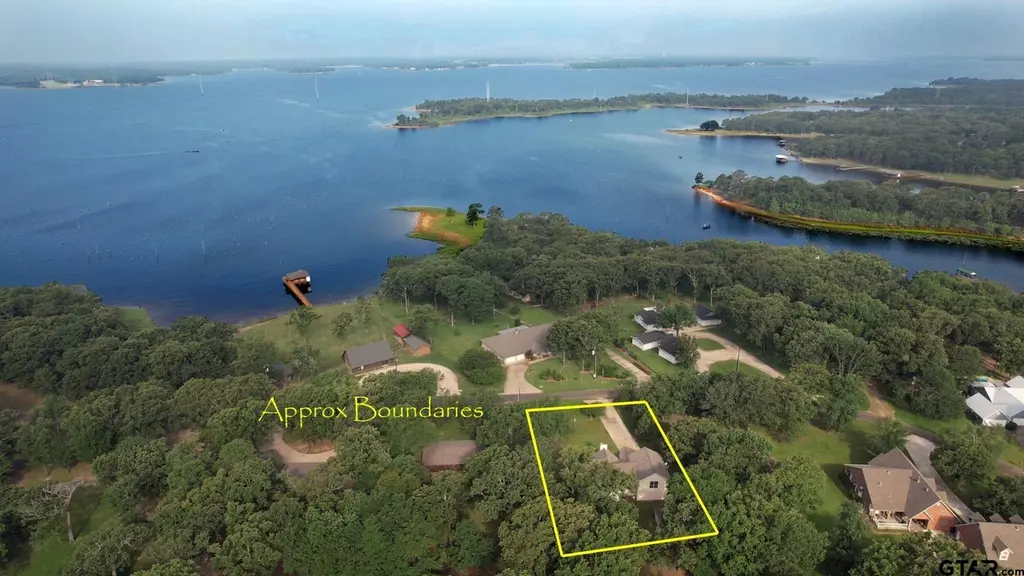
187 County Road 1997
Alba, TX 75497
$290,000D-
3 bd · 3.0 ba ·
2,014 sqft ·
Built 1988
· SingleFamily
· Pending
· 20 DOM
Cashflow @ list (25.0% down · 7.5%)
Estimated rent
$1,284/mo
Mortgage (P&I)
−$1,521
Tax + insurance
−$469
HOA
−$0
Vac / Maint / Mgmt
−$270
Net cashflow
$-976/mo
Annual
$-11,707/yr
Cap rate
2.26%
Cash-on-cash
-14.42%
DSCR
0.36
1% rule
0.44%
Cash to close
$81,200
Investor read
- This is a 3-bed/3.0-bath single-family listed at $290k.
- At list price, monthly cash flow is $-976 ($-12k/yr) — negative.
- To cash-flow at today's rent, offer at most $118k (59.4% below list).
- To meet the 1% rule (rent ≥ 1% of price), the offer needs to be $128k (55.7% below list).
- It's been on market 20 days — a 2% lower offer ($286k) is reasonable based on typical stale-listing flexibility.
- Recommended offer: $118k (59.4% below list) — sets the bar for cash-flow.
- In year one you build about $31k of equity ($2k loan paydown + $29k appreciation (10.0% local appreciation)).
- Location reads 65/100 on livability (#724 in TX) — a middle-class / working-renter tenant base. Strengths: cost of living A+, housing A+, health & safety A; Watch: crime D, amenities F, commute F.
- Yantis ISD (rural): math 38% / reading 44% proficiency, ranked #660 of 1,141 in TX (top 58%) — families likely to look elsewhere, expect single-tenant / working-renter base with shorter leases.
- Zoned schools: Yantis El (math 47% / reading 47%, grade D-, #1,006 of 4,322 statewide, top 25%, 192 students, 78% FRL) — zoned schools average 78% FRL vs 50% district-wide (27 pts higher); higher-poverty schools than district average — tighter screening recommended.
- Market conditions: 138 active listings in the ZIP; 72 units permitted in Wood County in 2024 (29 in 5+ unit buildings).
- Wood County population projected at +12% by 2050 — modest demand growth; plan on rents tracking national, not racing it.
- 2 sale attempts with the ask held roughly flat each time — persistent listings suggest the price (not the market) is what's stuck; bring a comps-based counter.
- By year 2, paydown + projected appreciation supports a ~$50k cash-out refi (75% LTV) — recoverable capital for the next deal without selling this one.
- Climate carrying-cost: major wind risk, 27% chance of damaging wind over 30y; extreme-heat days projected 7→24/yr by 2055 (HVAC capex compounding) — expect insurance premiums to compound above CPI over the hold.
- Cap rate 2.3% vs local median 1.7% in Alba — top-decile yield for the area; either an underpriced asset or a hidden risk that comps aren't pricing in. Stress-test before assuming the spread holds.
Questions for listing agent
- What do current leases actually rent for vs. the listed asking? Can we see a recent rent roll and the last 12 months of T-12 income?
- Is there a deadline driving the sale (1031 exchange, divorce, estate, relocation)? That informs how much negotiation room exists.
- Schools are D-rated, which usually means shorter tenancies and higher turnover. Who's the typical renter profile here, and what's been the actual vacancy rate?
- Crime grade is D in this area — have there been break-ins, vandalism, or insurance claims at this property in the last 3 years? What carrier currently insures it and at what premium?
- The area grade is low — what's the realistic commute time and amenity access for the typical tenant pool here? Any planned neighborhood developments (good or bad) we should know about?
- What's the average days-on-market for RENTAL listings here right now (not sales)? A rising rental-DOM trend means longer vacancies and softer asking-rent achievability than the comps imply.
- What's the recent tenant-quality profile in this submarket — average credit score on applications, eviction rate, late-payment / NSF rate, and stable-employment percentage? A property-management company in the area should have these aggregated.
- How much new for-sale + rental construction is in the pipeline within 1–3 miles? Heavy new supply typically softens prices + rents 12–24 months out; constrained supply supports both.
CashFlowRE · CFR-7ZK1YMEV42QMCT
· Data 2 weeks ago
cashflowre.app · 2026-05-29