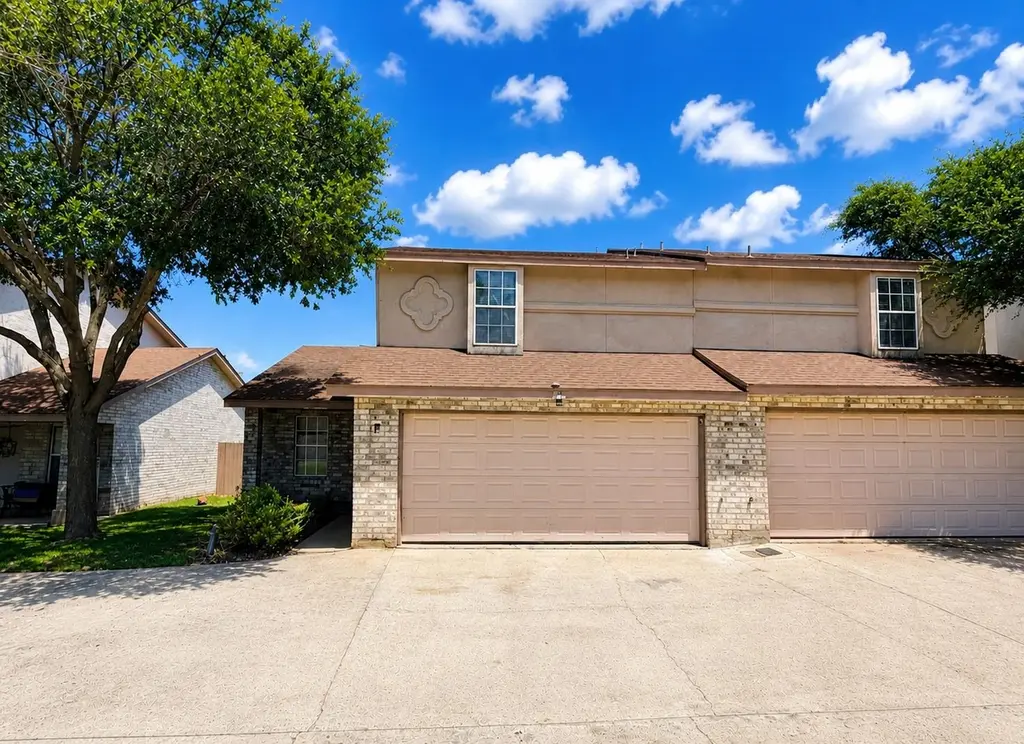
8801 Mcpherson Rd Unit 1F
Laredo, TX 78045
$240,000D
3 bd · 2.5 ba ·
1,520 sqft ·
Built 1995
· Condo
· Active
· 35 DOM
Cashflow @ list (25.0% down · 7.5%)
Estimated rent
$1,787/mo
Mortgage (P&I)
−$1,259
Tax + insurance
−$400
HOA
−$0
Vac / Maint / Mgmt
−$375
Net cashflow
$-247/mo
Annual
$-2,964/yr
Cap rate
5.06%
Cash-on-cash
-4.41%
DSCR
0.80
1% rule
0.74%
Cash to close
$67,200
Investor read
- This is a 3-bed/2.5-bath condo listed at $240k.
- At list price, monthly cash flow is $-247 ($-3k/yr) — negative.
- To cash-flow at today's rent, offer at most $204k (14.9% below list).
- To meet the 1% rule (rent ≥ 1% of price), the offer needs to be $179k (25.5% below list).
- It's been on market 35 days — a 3% lower offer ($233k) is reasonable based on typical stale-listing flexibility.
- Recommended offer: $179k (25.5% below list) — sets the bar for 1% rule.
- Local home prices are declining (-3.0%/yr); year-one equity from $2k of loan paydown is wiped out by about $7k of value loss. Plan a longer hold.
- Location reads 73/100 on livability (#227 in TX) — a middle-class / working-renter tenant base. Strengths: cost of living A+, housing A+, health & safety A+; Watch: schools C-, crime C-, employment D+.
- United ISD (urban): math 27% / reading 38% proficiency, ranked #568 of 826 in TX (top 69%) — families likely to look elsewhere, expect single-tenant / working-renter base with shorter leases; 72% free/reduced lunch — lower-income household profile, screen leases tightly.
- Market conditions: Rents rising fast (+4.7%/yr); 383 active listings in the ZIP; 34 comparable units currently listed for rent nearby; rentals lingering (median 44d on market — plan ~5-8 weeks vacancy on turnover, expect pricing pressure); 100% of comp listings sitting > 30 days — soft ceiling on asking rent; solid renter incomes; 1,448 units permitted in Webb County in 2024 (245 in 5+ unit buildings).
- Webb County population projected at +23% by 2050 — long-run rental-demand tailwind backs the buy-and-hold thesis.
- 2 sale attempts with the ask held roughly flat each time — persistent listings suggest the price (not the market) is what's stuck; bring a comps-based counter.
- Cap rate 5.1% vs local median 4.1% in Laredo — meaningfully above typical; check what's discounted (condition, days-on-market, listing class) to confirm the premium yield is real.
Questions for listing agent
- What do current leases actually rent for vs. the listed asking? Can we see a recent rent roll and the last 12 months of T-12 income?
- It's been on market 35 days. Have you received any prior offers? Is the seller open to a 26% concession, seller financing, or rate buy-down credit?
- Any open or pending special assessments — roof, HVAC, plumbing, elevator, façade? What's the per-unit balance and payoff schedule, and is the seller paying it off at close or rolling it to the buyer?
- Is there a deadline driving the sale (1031 exchange, divorce, estate, relocation)? That informs how much negotiation room exists.
- The area grade is low — what's the realistic commute time and amenity access for the typical tenant pool here? Any planned neighborhood developments (good or bad) we should know about?
- What's the average days-on-market for RENTAL listings here right now (not sales)? A rising rental-DOM trend means longer vacancies and softer asking-rent achievability than the comps imply.
- What's the recent tenant-quality profile in this submarket — average credit score on applications, eviction rate, late-payment / NSF rate, and stable-employment percentage? A property-management company in the area should have these aggregated.
- How much new apartment / multifamily construction is in the pipeline within 1–3 miles? Heavy new supply (>2% of stock underway) typically softens rents 12–24 months out; light construction supports rent growth.
CashFlowRE · CFR-82TSM456N0MV3F
· Data 1 day ago
cashflowre.app · 2026-05-29