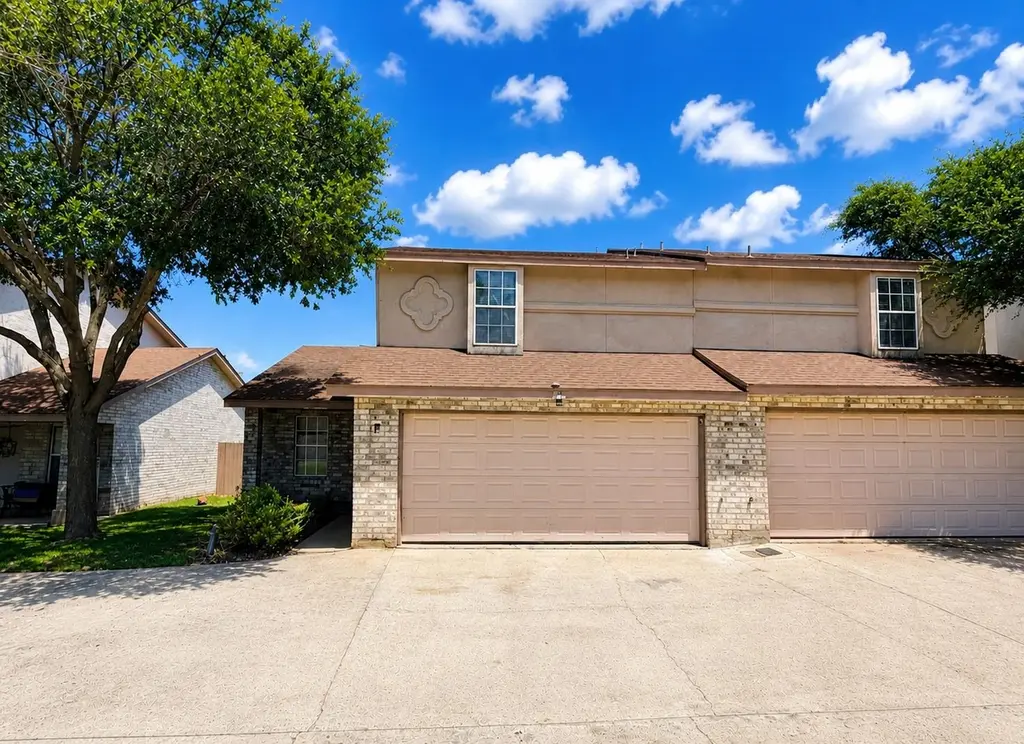
8801 Mcpherson Rd Unit 1F · Laredo, TX
Flood risk No data
- FEMA flood zone
- —
- Chance of flooding over 30 yrs
- —
- Est. flood insurance / yr
- —
Fire risk No data
- Est. fire insurance / yr
- —
Heat risk No data
- Hot days now (above threshold)
- —
- Hot days in 30 yrs
- —
Wind risk No data
- Chance of severe wind over 30 yrs
- —
Air-quality risk No data
- Unhealthy air days now
- —
- Unhealthy air days in 30 yrs
- —
Risk factors via First Street. Map © Google.
Why this score? — see what drove the D grade
The composite is a weighted blend of 9 inputs, each scored 0–100. Each bar is that input's sub-score; the figure is the points it added to the 100-point composite (weight × sub-score).
- ARV discount +15.0/15.0
- Cash flow +8.0/30.0
- Rent growth +3.7/5.0
- Livability +3.7/5.0
- Schools +2.8/10.0
- Condition / age +2.5/5.0
- 1% rule +2.4/10.0
- DSCR +2.0/10.0
- Appreciation +0.0/10.0
$240,000
🖨 Deal sheet 📄 Offer letter ✓ Due diligence
Listing remarks
Beautiful two story condo featuring 3 bedrooms, 2.5 bathrooms, and a 2 car garage. This lovely home offers granite countertops, tile floors, and a functional open layout with beautiful finishes throughout. Conveniently located near shopping, restaurants, and more. This lovely condo also offers access to great community amenities, including a community pool and basketball court. Schedule your tour today. Great investment property.
Key facts
- Tile floors
- Community pool
- Open layout
Tags
Property features AI
Finance
- HOA & community: Gated community
Exterior
- Parking: Attached concrete 2-car garage
- Security: Gated community
- Utilities: Public water; Underground utilities
- Home design: Condo/Townhouse; 2 stories
- Construction: Brick veneer and stucco exterior; Slab foundation
- Exterior features: Wood fencing; Level lot; Outdoor private pool
Interior
- Kitchen: Dishwasher; Microwave; Range; Refrigerator
- Flooring: Tile
- Bathrooms: 2 full bathrooms; 1 half bathroom
- Heating & cooling: Central heating (electric); Central air conditioning
- Interior features: Tile flooring; Dishwasher; Microwave; Range; Refrigerator; Electric water heater; Central air conditioning; Central electric heating
- Laundry & utility: Electric water heater
Neighborhood map
What this means for you Summary
Snapshot
- This is a 3-bed/2.5-bath condo listed at $240k.
Deal economics
- At list price, monthly cash flow is $-247 ($-3k/yr) — negative.
- To cash-flow at today's rent, offer at most $204k (14.9% below list).
- To meet the 1% rule (rent ≥ 1% of price), the offer needs to be $179k (25.5% below list).
- Recommended offer: $179k (25.5% below list) — sets the bar for 1% rule.
- Cap rate 5.1% vs local median 4.1% in Laredo — meaningfully above typical; check what's discounted (condition, days-on-market, listing class) to confirm the premium yield is real.
Location & tenants
- Location reads 73/100 on livability (#227 in TX) — a middle-class / working-renter tenant base. Strengths: cost of living A+, housing A+, health & safety A+; Watch: schools C-, crime C-, employment D+.
- United ISD (urban): math 27% / reading 38% proficiency, ranked #568 of 826 in TX (top 69%) — families likely to look elsewhere, expect single-tenant / working-renter base with shorter leases; 72% free/reduced lunch — lower-income household profile, screen leases tightly.
- Market conditions: Rents rising fast (+4.7%/yr); 383 active listings in the ZIP; 34 comparable units currently listed for rent nearby; rentals lingering (median 44d on market — plan ~5-8 weeks vacancy on turnover, expect pricing pressure); 100% of comp listings sitting > 30 days — soft ceiling on asking rent; solid renter incomes; 1,448 units permitted in Webb County in 2024 (245 in 5+ unit buildings).
Forward outlook
- Local home prices are declining (-3.0%/yr); year-one equity from $2k of loan paydown is wiped out by about $7k of value loss. Plan a longer hold.
- Webb County population projected at +23% by 2050 — long-run rental-demand tailwind backs the buy-and-hold thesis.
Negotiation context
- It's been on market 35 days — a 3% lower offer ($233k) is reasonable based on typical stale-listing flexibility.
- 2 sale attempts with the ask held roughly flat each time — persistent listings suggest the price (not the market) is what's stuck; bring a comps-based counter.
Questions for the listing agent
- What do current leases actually rent for vs. the listed asking? Can we see a recent rent roll and the last 12 months of T-12 income?
- It's been on market 35 days. Have you received any prior offers? Is the seller open to a 26% concession, seller financing, or rate buy-down credit?
- Any open or pending special assessments — roof, HVAC, plumbing, elevator, façade? What's the per-unit balance and payoff schedule, and is the seller paying it off at close or rolling it to the buyer?
- Is there a deadline driving the sale (1031 exchange, divorce, estate, relocation)? That informs how much negotiation room exists.
- The area grade is low — what's the realistic commute time and amenity access for the typical tenant pool here? Any planned neighborhood developments (good or bad) we should know about?
- What's the average days-on-market for RENTAL listings here right now (not sales)? A rising rental-DOM trend means longer vacancies and softer asking-rent achievability than the comps imply.
- What's the recent tenant-quality profile in this submarket — average credit score on applications, eviction rate, late-payment / NSF rate, and stable-employment percentage? A property-management company in the area should have these aggregated.
- How much new apartment / multifamily construction is in the pipeline within 1–3 miles? Heavy new supply (>2% of stock underway) typically softens rents 12–24 months out; light construction supports rent growth.
Investment metrics
- 1% rule
- 0.74% ✗
- Cap rate
- 5.06%
- Cash-on-cash
- -4.41%
- DSCR
- 0.80
- GRM
- 11.2
CMA / ARV
- ARV (median comp)
- $301,848
- List price
- $240,000
- Delta
- -20.49%
- Verdict
- UNDERPRICED
- Comps
- 4 within 1.0 mi
Projected returns pro-forma
-3.0% appreciation · 4.7% rent growth · sell at horizon
- IRR
- -21.9%
- Equity multiple
- 0.23×
- Total profit
- $-51,485
- Equity at exit
- $35,785
- IRR
- -12.1%
- Equity multiple
- 0.23×
- Total profit
- $-51,772
- Equity at exit
- $20,751
Cash invested: $67,200 (down + closing). Projections, not guarantees.
Landlord ↔ Tenant lean methodology
- Overall (STATE)
- 87 Strongly Landlord-Friendly
- State Texas
- 87 Strongly Landlord-Friendly · R+5
- County
- — inherits STATE
- City
- — inherits STATE
ZIP-level market 78045
- Home prices YoY
- -34.5%
- Rents YoY
- 4.7%
- Active inventory
- 383
- Price-to-rent
- 11.2×
Monthly cashflow live
- Estimated rent
- $1,787 high interval (Pro) →
- Mortgage (P&I)
- −$1,259
- Tax est. 1.5%
- −$300 /mo · $3,600/yr
- Insurance
- −$100
- HOA
- −$0
- Vacancy / Maint / Mgmt
- −$375
- Net cashflow
- $-247
Break-even live
UW: 25.0% down · 7.5% · 30yr · 1.5% tax · 5.0% vac · 8.0% maint · 8.0% mgmt
Financing live
Cash to close
- Down payment
- $60,000
- Closing costs
- $7,200
- Reserves months
- —
- Total cash needed
- —
Loan-product check · same deal, 3 products live
Conventional
25% down · 7.5% · 30yr
- Down + closing
- —
- Monthly P&I
- —
- Monthly cashflow
- —
- DSCR
- —
- Eligible?
- —
Personal DTI + credit; lowest rate.
DSCR
20% down · 8.5% · 30yr
- Down + closing
- —
- Monthly P&I
- —
- Monthly cashflow
- —
- DSCR
- —
- Eligible?
- —
No personal income docs; deal must DSCR.
Hard money
10% down · 12.0% · 12mo
- Down + closing
- —
- Monthly P&I
- —
- Monthly cashflow
- —
- DSCR
- —
- Eligible?
- —
Short-term bridge; refi at stabilization.
Rent comps 34 comps
| Address | Beds | Baths | Sqft | Rent | $/sqft | DOM | Units | Dist |
|---|---|---|---|---|---|---|---|---|
| 8911 McPherson Rd Unit 9B Laredo, TX | 2.0 | 2.5 | 1172 | $1,300 | $1.11 | 44d | 1 | 0.03mi |
| 8801 McPherson Rd Unit 4 B Laredo, TX | 3.0 | 2.5 | 1520 | $1,650 | $1.09 | 44d | 1 | 0.04mi |
| 705 Puig Dr Laredo, TX | 3.0 | 2.0 | 1753 | $2,200 | $1.25 | 44d | 1 | 0.25mi |
| 510 Shiloh Dr Unit 402 Laredo, TX | 3.0 | 2.5 | 1355 | $1,850 | $1.37 | 44d | 1 | 0.44mi |
| 9653 McPherson Rd Laredo, TX | 3.0 | 2.5 | 1764 | $2,275 | $1.29 | 44d | 2 | 0.51mi |
| 1010 Monaco Blvd Unit 14 Laredo, TX | 2.0 | 2.5 | 1079 | $1,650 | $1.53 | 44d | 1 | 0.51mi |
| 506 Shiloh Dr #9 Laredo, TX | 3.0 | 2.0 | 1240 | $1,650 | $1.33 | 44d | 1 | 0.52mi |
| 9805 Sterling Loop #201 Laredo, TX | 3.0 | 2.0 | 1316 | $1,600 | $1.22 | 44d | 1 | 0.55mi |
| 1000 Ranchway Dr #67 Laredo, TX | 3.0 | 3.0 | 1406 | $1,600 | $1.14 | 44d | 1 | 0.60mi |
| 9802 Cantera Ct Unit 108A Laredo, TX | 3.0 | 2.0 | 1164 | $1,350 | $1.16 | 44d | 1 | 0.64mi |
| 9804 Cantera Ct #47 Laredo, TX | 3.0 | 2.0 | 1232 | $1,450 | $1.18 | 44d | 1 | 0.66mi |
| 1006 Laurel Dr Laredo, TX | 4.0 | 2.0 | 1531 | $1,600 | $1.05 | 44d | 1 | 0.68mi |
| 411 Shiloh Dr Unit 9 Laredo, TX | 3.0 | 2.5 | 1750 | $1,675 | $0.96 | 44d | 1 | 0.74mi |
| 1513 Sweden Ln Laredo, TX | 3.0 | 2.0 | 1588 | $1,800 | $1.13 | 44d | 1 | 0.75mi |
| 2619 San Isidro Pkwy Unit 305 Laredo, TX | 2.0 | 2.5 | 1306 | $1,800 | $1.38 | 44d | 1 | 0.86mi |
| 2619 San Isidro Pkwy Unit 606 Laredo, TX | 2.0 | 1.5 | 1112 | $1,900 | $1.71 | 44d | 1 | 0.86mi |
| 2619 San Isidro Pkwy #603 Laredo, TX | 2.0 | 2.5 | 1406 | $1,750 | $1.24 | 44d | 1 | 0.87mi |
| 305 Deer Path Loop Laredo, TX | 3.0 | 2.5 | 2019 | $3,500 | $1.73 | 44d | 1 | 0.88mi |
| 423 Deer Path Loop Laredo, TX | 4.0 | 2.5 | 1803 | $2,300 | $1.28 | 44d | 1 | 0.93mi |
| 425 Deer Path Loop Laredo, TX | 3.0 | 2.5 | 1852 | $3,500 | $1.89 | 44d | 1 | 0.94mi |
| 1709 Kingwood Dr Laredo, TX | 3.0 | 2.0 | 1443 | $1,800 | $1.25 | 44d | 1 | 0.94mi |
| 202 Deer Path Loop Laredo, TX | 3.0 | 2.5 | 1912 | $2,300 | $1.20 | 44d | 1 | 0.94mi |
| 510 Deer Path Loop Laredo, TX | 3.0 | 2.5 | 1852 | $2,300 | $1.24 | 44d | 1 | 0.99mi |
| 115 Yellow Oak Ave Laredo, TX | 3.0 | 2.0 | 1465 | $1,400 | $0.96 | 44d | 1 | 1.03mi |
| 10510 Sandia Dr #402 Laredo, TX | 3.0 | 2.5 | 1405 | $1,700 | $1.21 | 44d | 1 | 1.09mi |
| 2445 Monarch Dr #704 Laredo, TX | 3.0 | 2.5 | 1493 | $1,850 | $1.24 | 44d | 1 | 1.19mi |
| 7521 Country Club Dr Unit 106 Laredo, TX | 3.0 | 2.5 | 1817 | $2,800 | $1.54 | 44d | 1 | 1.28mi |
| 1851 Arctic Ct Laredo, TX | 3.0 | 2.0 | 1218 | $1,850 | $1.52 | 44d | 1 | 1.29mi |
| 7550 Country Club Dr Laredo, TX | 1.0–3.0 | 1.0–2.0 | 826 | $1,760 | $2.13 | 44d | 23 | 1.31mi |
| 312 Cambridge Loop Laredo, TX | 4.0 | 2.0 | 2083 | $2,200 | $1.06 | 44d | 1 | 1.32mi |
| 2912 Sun Dance Loop Laredo, TX | 3.0 | 2.5 | 1940 | $2,250 | $1.16 | 44d | 1 | 1.36mi |
| 8604 Superior Dr Laredo, TX | 3.0 | 2.0 | 1216 | $1,400 | $1.15 | 44d | 1 | 1.40mi |
| 10706 International Blvd #120 Laredo, TX | 2.0 | 2.0 | 1065 | $1,350 | $1.27 | 44d | 1 | 1.41mi |
| 8508 Superior Dr Laredo, TX | 3.0 | 2.0 | 1216 | $1,300 | $1.07 | 44d | 1 | 1.42mi |
HOA detail condo
- Monthly dues
- $0 · $0/yr
- Likely covers
- pool
- Assessments
- None detected in remarks — confirm with the listing agent.
Listing history 19 events
-
2026-06-19days on market $240,000 Active 35 DOM
-
2026-06-18days on market $240,000 Active 34 DOM
-
2026-06-17days on market $240,000 Active 33 DOM
-
2026-06-16days on market $240,000 Active 32 DOM
-
2026-06-15days on market $240,000 Active 31 DOM
-
2026-06-14days on market $240,000 Active 29 DOM
-
2026-06-13days on market $240,000 Active 28 DOM
-
2026-06-10days on market $240,000 Active 26 DOM
-
2026-06-09days on market $240,000 Active 25 DOM
-
2026-06-08days on market $240,000 Active 24 DOM
-
2026-06-07days on market $240,000 Active 23 DOM
-
2026-06-03days on market $240,000 Active 19 DOM
-
2026-06-02days on market $240,000 Active 18 DOM
-
2026-06-01days on market $240,000 Active 17 DOM
-
2026-05-31days on market $240,000 Active 16 DOM
-
2026-05-30days on market $240,000 Active 15 DOM
-
2026-05-15$240,000 Active 433-char remark
-
2026-05-05historical $1,800
-
2026-04-19$1,800
ⓘ Source: listings_history table (triggers on properties + properties_extension) + one-shot
backfill from property_details.listing_events for pre-trigger history.
Nearby sold comps map
Loading sold comps map…
Walkable amenities ~0.75 mi
Loading nearby amenities…
Taxation est. · year 1
- Rental income
- $21,442
- − Mortgage interest
- −$13,444
- − Property taxes
- −$3,600
- − Insurance
- −$1,200
- − Repairs & maintenance
- −$1,715
- − Management
- −$1,715
- − Depreciation
- −$6,982
- Taxable loss
- −$7,214
- Est. tax savings @ 24.0%
- +$1,731
- After-tax cash flow
- $-1,232/yr
For passive investors: Depreciation is non-cash, so a rental often shows a tax loss while cash-flowing — sheltering income. Rental losses are passive: they offset passive income freely, and up to $25,000/yr can offset ordinary (W-2) income if you actively participate and your MAGI is under $100k (phasing out to $0 by $150k); unused losses carry forward. On sale, claimed depreciation is recaptured at up to 25%, and gains may owe capital-gains tax (a 1031 exchange can defer both). Figures are a year-1 estimate at your 24.0% rate — not tax advice; consult a CPA.
Schools (NCES district)
- District
- United ISD
- NCES district ID
- 4843650
- Math proficiency
- 27% ▼ -36.00%
- Reading proficiency
- 38% ▼ -11.00%
- Median HH income
- $47,780
- Composite
- 28.02/100
- National rank
- #6848
- State rank
- #568 of 826 in TX
Livability — Laredo
- Score
- 73/100
- State rank
- #227
- US rank
- #5399
Category grades
Schools grade is shown separately in the Schools card above.
Census & demographics
- Census place
- Laredo, TX
- County
- Webb County · 67,333 people
- City population
- 67,333
- Metro
- Laredo, TX
- Population (ZIP)
- 67,333
- Household income
- $90,608
- Rent vs Own
- Severe rent burden
- 1042.0
Population outlook (Webb County) Hauer SSP2
- Today (2025)
- 301,387 people
- By 2030
- 316,307 · +5.0%
- By 2040
- 345,636 · +14.7%
- By 2050
- 370,647 · +23.0%
- By 2075
- 413,907 · +37.3%
- By 2100
- 416,458 · +38.2%
Race, ethnicity, and origin ACS 2023
- Neighborhood character
- Predominantly Hispanic (93%)
- Race & ethnicity
- Hispanic / Latino 93% Two or more races 50% White 5%
- Hispanic origin (detail)
- Mexican 87%
- Foreign-born
- 26% · Canada
- Languages at home
- 16% English-only · Spanish 82%
Political lean MEDSL · Webb
- 2024 margin
- Toss-up / Even · D 48.5% · R 50.7%
- 2008→2024 swing
- -45.6pp toward R · 2008: 43.4pp · 2024: -2.2pp
- All cycles
- 2024: R+2.2 2020: D+23.3 2016: D+51.6 2012: D+54.0 2008: D+43.4
Not yet ingested
- Civics
- —
Market trends
- HPI YoY
- ▼ -88.24%
- Current HPI
- 167.3597
- Rent YoY
- ▲ 4.70%
- Metro
- Laredo, TX
- State GDP YoY
- ▲ 3.95%
- F500 in state
- 110
Industry mix (Fortune 500 HQ in TX)
| Industry | F500 HQs | Revenue |
|---|---|---|
| Energy | 16 | $1,198B |
|
||
| Technology | 5 | $198B |
|
||
| Engineering / Construction | 4 | $72B |
|
||
| Energy Services | 3 | $60B |
|
||
| Utilities | 3 | $41B |
|
||
| Healthcare | 2 | $330B |
|
||
Price history
+13233.3% since first listed3 events — show timeline
- 2026-05-15 Listed $240,000 LAOR
- 2026-05-05 Rental Removed $1,800 LAOR
- 2026-04-19 Listed for Rent $1,800 LAOR
Cash-flow waterfall
monthlySold comps — $/sqft
last 12 mo · ≤1 miLoading sold comps…