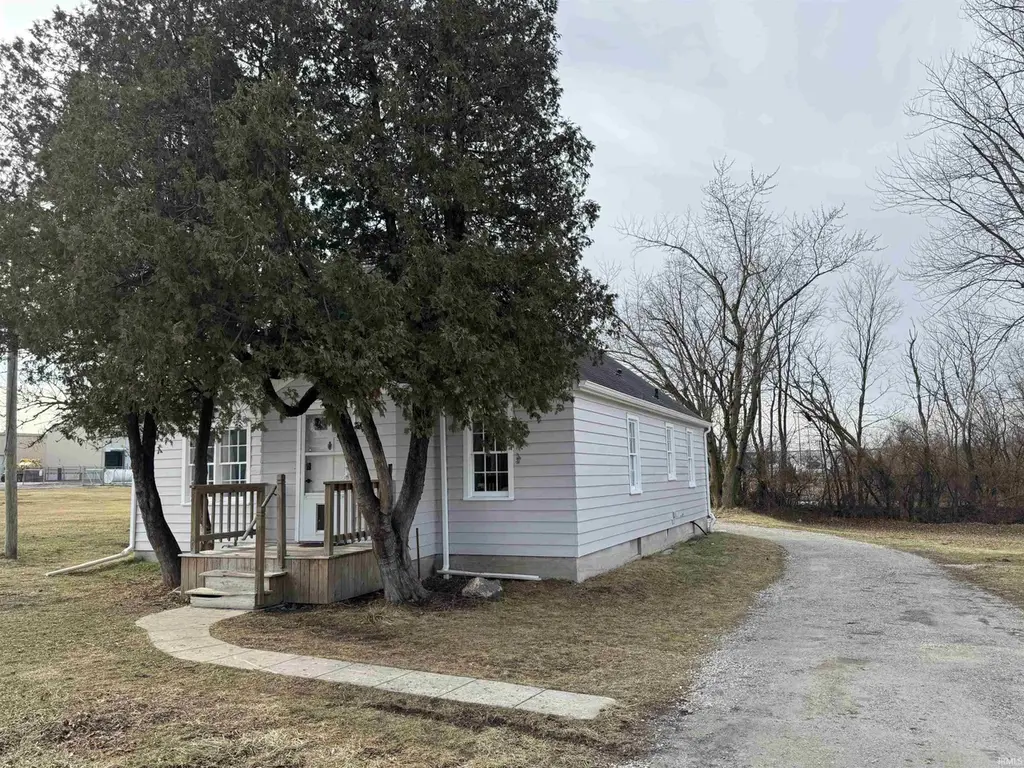
1930 Bremer Rd
New Haven, IN 46803
$165,000C-
2 bd · 1.0 ba ·
1,520 sqft ·
Built 1946
· SingleFamily
· Active
· 136 DOM
Cashflow @ list (25.0% down · 7.5%)
Estimated rent
$1,265/mo
Mortgage (P&I)
−$865
Tax + insurance
−$147
HOA
−$0
Vac / Maint / Mgmt
−$266
Net cashflow
$-13/mo
Annual
$-158/yr
Cap rate
6.20%
Cash-on-cash
-0.34%
DSCR
0.98
1% rule
0.77%
Cash to close
$46,200
Investor read
- This is a 2-bed/1.0-bath single-family listed at $165k.
- At list price, monthly cash flow is $-13 ($-158/yr) — negative.
- To cash-flow at today's rent, offer at most $163k (1.4% below list).
- To meet the 1% rule (rent ≥ 1% of price), the offer needs to be $126k (23.3% below list).
- It's been on market 136 days — a 12% lower offer ($145k) is reasonable based on typical stale-listing flexibility.
- Recommended offer: $126k (23.3% below list) — sets the bar for 1% rule.
- In year one you build about $18k of equity ($1k loan paydown + $16k appreciation (10.0% local appreciation)).
- Location reads 70/100 on livability (#149 in IN) — a middle-class / working-renter tenant base. Strengths: cost of living A+, housing A+, crime B+; Watch: schools D+, employment D, amenities F.
- East Allen County Schools (suburban): math 36% / reading 47% proficiency, ranked #122 of 301 in IN (top 40%) — families likely to look elsewhere, expect single-tenant / working-renter base with shorter leases.
- Watch-outs: built in 1946 — expect roof / HVAC / electrical / plumbing capex.
- Market conditions: 52 active listings in the ZIP; 3 comparable units currently listed for rent nearby; rentals at typical pace (median 22d on market — plan ~3-4 weeks tenant-placement turnaround); lower-income renter base — watch delinquency; 1,861 units permitted in Allen County in 2024 (576 in 5+ unit buildings).
- Allen County population projected at +10% by 2050 — modest demand growth; plan on rents tracking national, not racing it.
- 2 sale attempts; this cycle's ask has dropped $15k (8%) from the opening price — seller is motivated, your offer sets the floor, not the list.
- At projected returns (10.0% appreciation + 3.0% rent growth), your $46k cash investment doubles in ~3 years — after that, you're playing with house money.
- By year 3, paydown + projected appreciation supports a ~$45k cash-out refi (75% LTV) — recoverable capital for the next deal without selling this one.
- Cap rate 6.2% vs local median 4.9% in New Haven — meaningfully above typical; check what's discounted (condition, days-on-market, listing class) to confirm the premium yield is real.
- This rent runs 44% of the median local income ($34k/yr) — at the standard rent-burdened threshold; future hikes will face affordability resistance.
Questions for listing agent
- What do current leases actually rent for vs. the listed asking? Can we see a recent rent roll and the last 12 months of T-12 income?
- It's been on market 136 days. Have you received any prior offers? Is the seller open to a 23% concession, seller financing, or rate buy-down credit?
- Built in 1946 — when were the roof, HVAC, electrical panel, plumbing, and water heater last replaced?
- Why hasn't it sold? Are there any deal-killer items the seller is aware of (foundation, flood, title, zoning, code violations)?
- Is there a deadline driving the sale (1031 exchange, divorce, estate, relocation)? That informs how much negotiation room exists.
- Schools are D-rated, which usually means shorter tenancies and higher turnover. Who's the typical renter profile here, and what's been the actual vacancy rate?
- What's the average days-on-market for RENTAL listings here right now (not sales)? A rising rental-DOM trend means longer vacancies and softer asking-rent achievability than the comps imply.
- What's the recent tenant-quality profile in this submarket — average credit score on applications, eviction rate, late-payment / NSF rate, and stable-employment percentage? A property-management company in the area should have these aggregated.
CashFlowRE · CFR-85J3PYEFYSGPDE
· Data 2 days ago
cashflowre.app · 2026-05-29