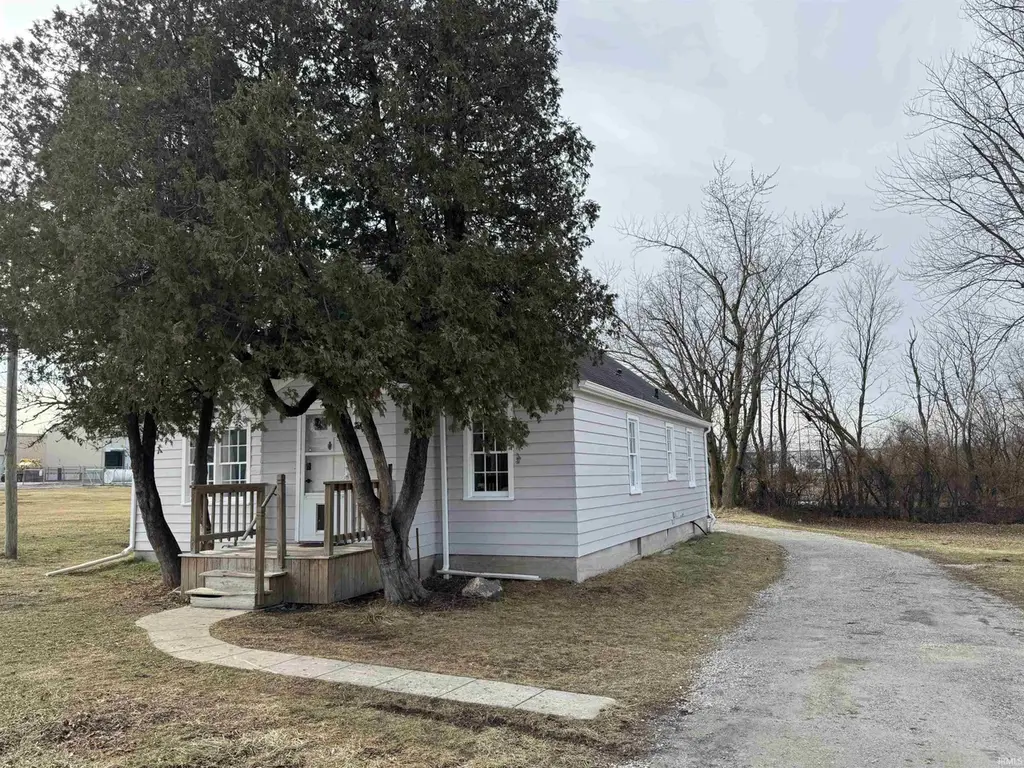
1930 Bremer Rd · New Haven, IN
Flood risk 1/10 · Minimal
- FEMA flood zone
- X (unshaded)
- Chance of flooding over 30 yrs
- 0.0%
- Est. flood insurance / yr
- $473 – $860
Fire risk 1/10 · Minimal
- Est. fire insurance / yr
- $717 – $1,331
Heat risk 3/10 · Minor
- Hot days now (above 100°F)
- 7 days/yr
- Hot days in 30 yrs
- 17 days/yr
Wind risk 2/10 · Minimal
- Chance of severe wind over 30 yrs
- —
Air-quality risk 3/10 · Minor
- Unhealthy air days now
- 2 days/yr
- Unhealthy air days in 30 yrs
- 3 days/yr
Risk factors via First Street. Map © Google.
Why this score? — see what drove the C- grade
The composite is a weighted blend of 9 inputs, each scored 0–100. Each bar is that input's sub-score; the figure is the points it added to the 100-point composite (weight × sub-score).
- Cash flow +12.9/30.0
- ARV discount +11.9/15.0
- Appreciation +10.0/10.0
- DSCR +3.8/10.0
- Schools +3.6/10.0
- Livability +3.5/5.0
- 1% rule +2.7/10.0
- Rent growth +2.5/5.0
- Condition / age +2.5/5.0
$165,000
🖨 Deal sheet 📄 Offer letter ✓ Due diligence
Listing remarks MLS
This beautifully updated home features a breakfast nook, dining room, ample kitchen counter space, two bedrooms downstairs, and a full upstairs master bedroom. Fresh paint and flooring throughout. There is no shortage of storage space with a full unfinished basement as well as a detached two car garage.
Key facts
- Breakfast nook
- Dining room
- 9,148 sq ft lot
Tags
Neighborhood map
What this means for you Summary
Snapshot
- This is a 2-bed/1.0-bath single-family listed at $165k.
Deal economics
- At list price, monthly cash flow is $-13 ($-158/yr) — negative.
- To cash-flow at today's rent, offer at most $163k (1.4% below list).
- To meet the 1% rule (rent ≥ 1% of price), the offer needs to be $126k (23.3% below list).
- Recommended offer: $126k (23.3% below list) — sets the bar for 1% rule.
- Cap rate 6.2% vs local median 4.9% in New Haven — meaningfully above typical; check what's discounted (condition, days-on-market, listing class) to confirm the premium yield is real.
Location & tenants
- Location reads 70/100 on livability (#149 in IN) — a middle-class / working-renter tenant base. Strengths: cost of living A+, housing A+, crime B+; Watch: schools D+, employment D, amenities F.
- East Allen County Schools (suburban): math 36% / reading 47% proficiency, ranked #122 of 301 in IN (top 40%) — families likely to look elsewhere, expect single-tenant / working-renter base with shorter leases.
- Market conditions: 52 active listings in the ZIP; 3 comparable units currently listed for rent nearby; rentals at typical pace (median 22d on market — plan ~3-4 weeks tenant-placement turnaround); lower-income renter base — watch delinquency; 1,861 units permitted in Allen County in 2024 (576 in 5+ unit buildings).
- This rent runs 44% of the median local income ($34k/yr) — at the standard rent-burdened threshold; future hikes will face affordability resistance.
Forward outlook
- In year one you build about $18k of equity ($1k loan paydown + $16k appreciation (10.0% local appreciation)).
- Allen County population projected at +10% by 2050 — modest demand growth; plan on rents tracking national, not racing it.
- At projected returns (10.0% appreciation + 3.0% rent growth), your $46k cash investment doubles in ~3 years — after that, you're playing with house money.
- By year 3, paydown + projected appreciation supports a ~$45k cash-out refi (75% LTV) — recoverable capital for the next deal without selling this one.
Negotiation context
- It's been on market 136 days — a 12% lower offer ($145k) is reasonable based on typical stale-listing flexibility.
- 2 sale attempts; this cycle's ask has dropped $15k (8%) from the opening price — seller is motivated, your offer sets the floor, not the list.
Risks & watch-outs
- Watch-outs: built in 1946 — expect roof / HVAC / electrical / plumbing capex.
Questions for the listing agent
- What do current leases actually rent for vs. the listed asking? Can we see a recent rent roll and the last 12 months of T-12 income?
- It's been on market 136 days. Have you received any prior offers? Is the seller open to a 23% concession, seller financing, or rate buy-down credit?
- Built in 1946 — when were the roof, HVAC, electrical panel, plumbing, and water heater last replaced?
- Why hasn't it sold? Are there any deal-killer items the seller is aware of (foundation, flood, title, zoning, code violations)?
- Is there a deadline driving the sale (1031 exchange, divorce, estate, relocation)? That informs how much negotiation room exists.
- Schools are D-rated, which usually means shorter tenancies and higher turnover. Who's the typical renter profile here, and what's been the actual vacancy rate?
- What's the average days-on-market for RENTAL listings here right now (not sales)? A rising rental-DOM trend means longer vacancies and softer asking-rent achievability than the comps imply.
- What's the recent tenant-quality profile in this submarket — average credit score on applications, eviction rate, late-payment / NSF rate, and stable-employment percentage? A property-management company in the area should have these aggregated.
- How much new for-sale + rental construction is in the pipeline within 1–3 miles? Heavy new supply typically softens prices + rents 12–24 months out; constrained supply supports both.
Investment metrics
- 1% rule
- 0.77% ✗
- Cap rate
- 6.20%
- Cash-on-cash
- -0.34%
- DSCR
- 0.98
- GRM
- 10.9
CMA / ARV
- ARV (median comp)
- $182,988
- List price
- $165,000
- Delta
- -9.83%
- Verdict
- FAIR
- Comps
- 20 within 1.0 mi
Show comp detail 6 sales within ~0.75 mi
| Address | Dist | Beds/Ba | Sqft | Sold | Price | $/sf | Match |
|---|---|---|---|---|---|---|---|
| 2611 Sheridan Rd | 0.40mi | 3/2.0 (+1) | 1,440 (-5%) | 0mo | $265,000 | $184 | 63 |
| 2046 Dellwood Dr | 0.55mi | 2/2.0 | 1,516 (-0%) | 20mo | $155,000 | $102 | 53 |
| 2225 Dellwood Dr | 0.61mi | 2/2.0 | 1,700 (+12%) | 1mo | $189,900 | $112 | 47 |
| 2010 Sunnymede Dr | 0.47mi | 3/1.0 (+1) | 1,682 (+11%) | 14mo | $182,000 | $108 | 43 |
| 2045 Medford Dr | 0.42mi | 3/2.0 (+1) | 1,636 (+8%) | 20mo | $154,397 | $94 | 42 |
| 2411 Dellwood Dr | 0.64mi | 3/1.0 (+1) | 1,665 (+10%) | 24mo | $192,000 | $115 | 29 |
Match score weights: distance 35% · size 25% · config 20% · recency 20%. Top-matched comps best support the ARV.
Projected returns pro-forma
10.0% appreciation · 3.0% rent growth · sell at horizon
- IRR
- 24.0%
- Equity multiple
- 2.93×
- Total profit
- $88,967
- Equity at exit
- $148,645
- IRR
- 21.3%
- Equity multiple
- 6.68×
- Total profit
- $262,532
- Equity at exit
- $320,559
Cash invested: $46,200 (down + closing). Projections, not guarantees.
Landlord ↔ Tenant lean methodology
- Overall (STATE)
- 90 Strongly Landlord-Friendly
- State Indiana
- 90 Strongly Landlord-Friendly · R+11
- County
- — inherits STATE
- City
- — inherits STATE
ZIP-level market 46803
- Active inventory
- 52
- Price-to-rent
- 10.9×
Monthly cashflow live
- Estimated rent
- $1,265 medium interval (Pro) →
- Mortgage (P&I)
- −$865
- Tax from tax record
- −$78 /mo · $940/yr
- Insurance
- −$69
- HOA
- −$0
- Vacancy / Maint / Mgmt
- −$266
- Net cashflow
- $-13
Break-even live
UW: 25.0% down · 7.5% · 30yr · 1.5% tax · 5.0% vac · 8.0% maint · 8.0% mgmt
Financing live
Cash to close
- Down payment
- $41,250
- Closing costs
- $4,950
- Reserves months
- —
- Total cash needed
- —
Loan-product check · same deal, 3 products live
Conventional
25% down · 7.5% · 30yr
- Down + closing
- —
- Monthly P&I
- —
- Monthly cashflow
- —
- DSCR
- —
- Eligible?
- —
Personal DTI + credit; lowest rate.
DSCR
20% down · 8.5% · 30yr
- Down + closing
- —
- Monthly P&I
- —
- Monthly cashflow
- —
- DSCR
- —
- Eligible?
- —
No personal income docs; deal must DSCR.
Hard money
10% down · 12.0% · 12mo
- Down + closing
- —
- Monthly P&I
- —
- Monthly cashflow
- —
- DSCR
- —
- Eligible?
- —
Short-term bridge; refi at stabilization.
Rent comps 3 comps
| Address | Beds | Baths | Sqft | Rent | $/sqft | DOM | Units | Dist |
|---|---|---|---|---|---|---|---|---|
| 2806 New Haven Ave Fort Wayne, IN | 3.0 | 1.0 | 1410 | $1,125 | $0.80 | 21d | 1 | 1.42mi |
| 2730 Chestnut St Fort Wayne, IN | 3.0 | 1.5 | 1312 | $950 | $0.72 | 21d | 1 | 1.43mi |
| 2396 Cinema Xing Fort Wayne, IN | 3.0 | 2.5 | 1580 | $1,999 | $1.27 | 44d | 15 | 1.48mi |
Listing history 20 events
-
2026-06-18days on market $165,000 Active 136 DOM
-
2026-06-17days on market $165,000 Active 135 DOM
-
2026-06-16days on market $165,000 Active 134 DOM
-
2026-06-15days on market $165,000 Active 133 DOM
-
2026-06-14days on market $165,000 Active 131 DOM
-
2026-06-13days on market $165,000 Active 130 DOM
-
2026-06-10days on market $165,000 Active 128 DOM
-
2026-06-09days on market $165,000 Active 127 DOM
-
2026-06-08days on market $165,000 Active 126 DOM
-
2026-06-07days on market $165,000 Active 125 DOM
-
2026-06-03days on market $165,000 Active 121 DOM
-
2026-06-02days on market $165,000 Active 120 DOM
-
2026-06-01days on market $165,000 Active 119 DOM
-
2026-05-31days on market $165,000 Active 118 DOM
-
2026-05-30days on market $165,000 Active 117 DOM
-
2026-04-13price $165,000 304-char remark
Show marketing remark (304 chars)
This beautifully updated home features a breakfast nook, dining room, ample kitchen counter space, two bedrooms downstairs, and a full upstairs master bedroom. Fresh paint and flooring throughout. There is no shortage of storage space with a full unfinished basement as well as a detached two car garage.
-
2026-03-28status Active 304-char remark
Show marketing remark (304 chars)
This beautifully updated home features a breakfast nook, dining room, ample kitchen counter space, two bedrooms downstairs, and a full upstairs master bedroom. Fresh paint and flooring throughout. There is no shortage of storage space with a full unfinished basement as well as a detached two car garage.
-
2026-03-09status Pending 304-char remark
Show marketing remark (304 chars)
This beautifully updated home features a breakfast nook, dining room, ample kitchen counter space, two bedrooms downstairs, and a full upstairs master bedroom. Fresh paint and flooring throughout. There is no shortage of storage space with a full unfinished basement as well as a detached two car garage.
-
2026-02-22price $170,000 304-char remark
Show marketing remark (304 chars)
This beautifully updated home features a breakfast nook, dining room, ample kitchen counter space, two bedrooms downstairs, and a full upstairs master bedroom. Fresh paint and flooring throughout. There is no shortage of storage space with a full unfinished basement as well as a detached two car garage.
-
2026-01-14$180,000 Active 304-char remark
Show marketing remark (304 chars)
This beautifully updated home features a breakfast nook, dining room, ample kitchen counter space, two bedrooms downstairs, and a full upstairs master bedroom. Fresh paint and flooring throughout. There is no shortage of storage space with a full unfinished basement as well as a detached two car garage.
ⓘ Source: listings_history table (triggers on properties + properties_extension) + one-shot
backfill from property_details.listing_events for pre-trigger history.
Tax reassessment forecast IN · Partial reset (capped growth)
- Current annual tax
- $940 · $78/mo
- Projected year-2 tax
- $1,171 · $98/mo
- Expected delta
- +$231/yr (+$19/mo · 24.6%)
ⓘ Screening estimate from a state-policy table — verify with the county assessor before closing.
Climate risk First Street
- Flood 1/10 Low FEMA zone X (unshaded) · 0% chance over 30 yrs
- Wildfire 1/10 Low
- Heat 3/10 Moderate 7 d/yr ≥100°F today · 17 d/yr by 30 yrs out
- Wind 2/10 Low
- Air quality 3/10 Moderate 2 unhealthy d/yr today · 3 by 30 yrs out
Nearby sold comps map
Loading sold comps map…
Walkable amenities ~0.75 mi
Loading nearby amenities…
Taxation est. · year 1
- Rental income
- $15,178
- − Mortgage interest
- −$9,243
- − Property taxes
- −$940
- − Insurance
- −$825
- − Repairs & maintenance
- −$1,214
- − Management
- −$1,214
- − Depreciation
- −$4,800
- Taxable loss
- −$3,058
- Est. tax savings @ 24.0%
- +$734
- After-tax cash flow
- $576/yr
For passive investors: Depreciation is non-cash, so a rental often shows a tax loss while cash-flowing — sheltering income. Rental losses are passive: they offset passive income freely, and up to $25,000/yr can offset ordinary (W-2) income if you actively participate and your MAGI is under $100k (phasing out to $0 by $150k); unused losses carry forward. On sale, claimed depreciation is recaptured at up to 25%, and gains may owe capital-gains tax (a 1031 exchange can defer both). Figures are a year-1 estimate at your 24.0% rate — not tax advice; consult a CPA.
Schools (NCES district)
- District
- East Allen County Schools
- NCES district ID
- 1802850
- Math proficiency
- 36% ▼ -8.00%
- Reading proficiency
- 47% ▼ -4.00%
- Median HH income
- $50,524
- Composite
- 35.75/100
- National rank
- #4849
- State rank
- #122 of 301 in IN
Livability — New Haven
- Score
- 70/100
- State rank
- #149
- US rank
- #7499
Category grades
Schools grade is shown separately in the Schools card above.
Census & demographics
- Census place
- New Haven, IN
- County
- Allen County · 326,813 people
- Metro
- Fort Wayne, IN
- Population (ZIP)
- 10,994
- Household income
- $34,381
- Rent vs Own
- Severe rent burden
- 660.0
Population outlook (Allen County) Hauer SSP2
- Today (2025)
- 394,020 people
- By 2030
- 405,128 · +2.8%
- By 2040
- 423,476 · +7.5%
- By 2050
- 435,137 · +10.4%
- By 2075
- 450,293 · +14.3%
- By 2100
- 424,101 · +7.6%
Race, ethnicity, and origin ACS 2023
- Neighborhood character
- Diverse neighborhood (Simpson 0.69)
- Race & ethnicity
- Black 42% White 27% Hispanic / Latino 24% Two or more races 10% Native American 2% Asian 1%
- Hispanic origin (detail)
- Mexican 17% Puerto Rican 1%
- Common ancestry
- Lithuanian 1% Iranian 1% Serbian 1%
- Foreign-born
- 11% · Canada, Philippines
- Languages at home
- 81% English-only · Spanish 16% Other Asian/Pacific 1% French/Haitian/Cajun 1%
Political lean MEDSL · Allen
- 2024 margin
- R (+12.5) · D 42.9% · R 55.4% · Other 1.7%
- 2008→2024 swing
- -8.1pp toward R · 2008: -4.3pp · 2024: -12.5pp
- All cycles
- 2024: R+12.5 2020: R+11.2 2016: R+19.6 2012: R+16.8 2008: R+4.3
Not yet ingested
- Civics
- —
Market trends
- HPI YoY
- ▲ 107.58%
- Current HPI
- 404.7976
- Rent YoY
- —
- Metro
- Fort Wayne, IN
- State GDP YoY
- ▲ 2.90%
- F500 in state
- 18
Industry mix (Fortune 500 HQ in IN)
| Industry | F500 HQs | Revenue |
|---|---|---|
| Industrial Machinery | 2 | $37B |
|
||
| Healthcare | 1 | $177B |
|
||
| Pharmaceuticals | 1 | $45B |
|
||
| Metals / Steel | 1 | $18B |
|
||
| Agriculture | 1 | $17B |
|
||
| Packaging | 1 | $12B |
|
||
Price history
-8.3% since first listed5 events — show timeline
- 2026-04-13 Price Changed $165,000 IRMLS
- 2026-03-28 Relisted — IRMLS
- 2026-03-09 Pending — IRMLS
- 2026-02-22 Price Changed $170,000 IRMLS
- 2026-01-14 Listed $180,000 IRMLS
Property tax history
+13.8%/yrLatest (2024): $940 · +2.6% YoY. Source: county tax records.
Cash-flow waterfall
monthlySold comps — $/sqft
last 12 mo · ≤1 miLoading sold comps…