32 Cr-1143a Dear Born Dr
Barbourville, KY 40906
$55,000B
2 bd · 1.0 ba ·
900 sqft ·
Built —
· SingleFamily
· Active
· 9 DOM
Cashflow @ list (25.0% down · 7.5%)
Estimated rent
$843/mo
Mortgage (P&I)
−$288
Tax + insurance
−$147
HOA
−$0
Vac / Maint / Mgmt
−$177
Net cashflow
$230/mo
Annual
$2,761/yr
Cap rate
12.52%
Cash-on-cash
22.26%
DSCR
1.99
1% rule
1.53%
Cash to close
$15,400
Investor read
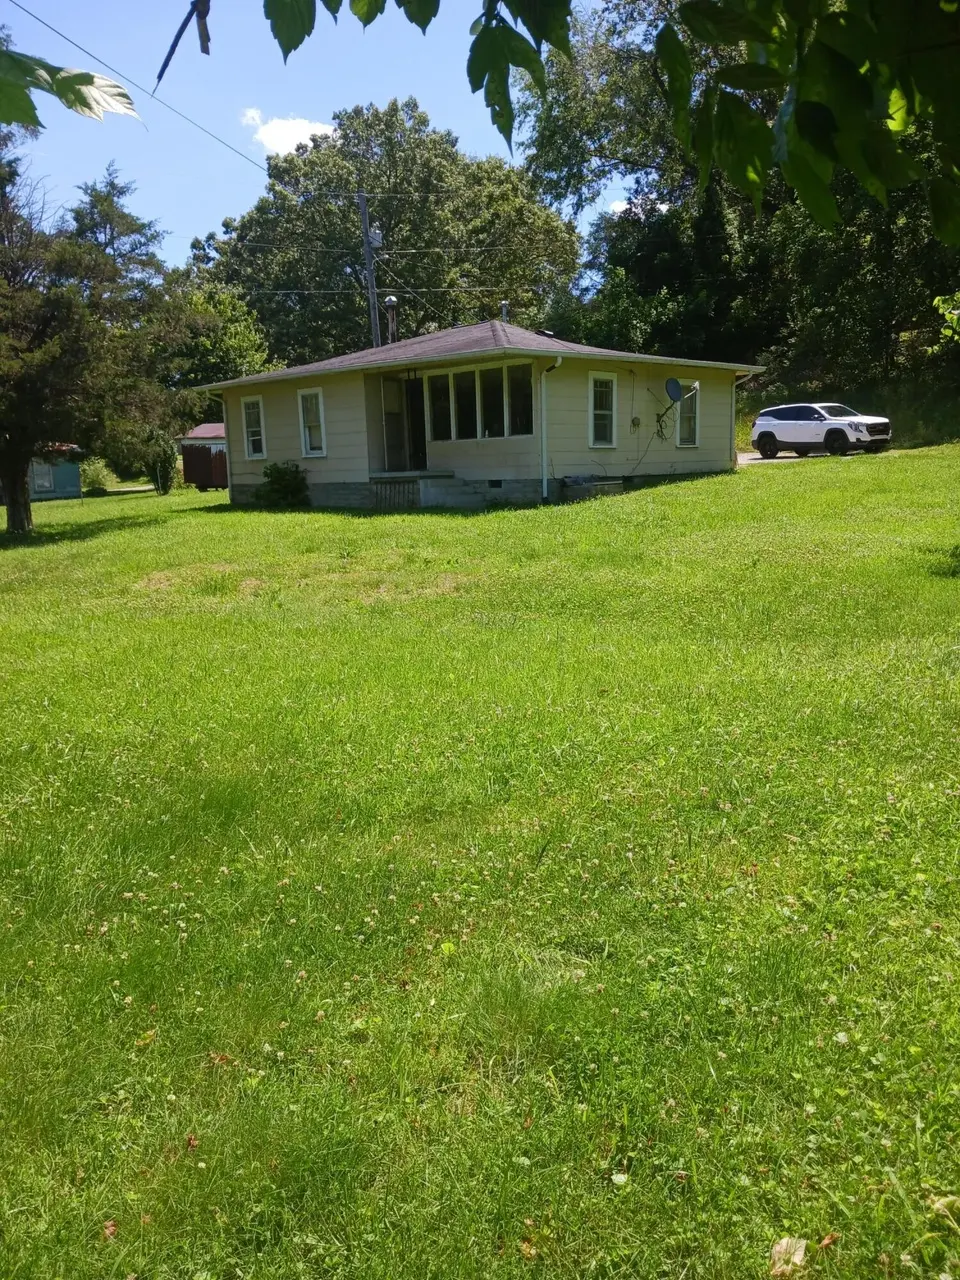
- This is a 2-bed/1.0-bath single-family listed at $55k. Condition is rated fair.
- At list price, monthly cash flow is $230 ($3k/yr) — positive.
- The deal already cash-flows at list — no discount required.
- Meets the 1% rule at list price ($843 rent vs $55k).
- Only 9 days on market — expect competitive offers; lowballing is unlikely to land.
- In year one you build about $2k of equity ($380 loan paydown + $2k appreciation (3.8% local appreciation)).
- Location reads 64/100 on livability (#284 in KY) — a middle-class / working-renter tenant base. Strengths: cost of living A+, crime A-, housing B; Watch: amenities F, commute F, employment F.
- Knox County (town): math 24% / reading 38% proficiency, ranked #116 of 165 in KY (top 70%) — families likely to look elsewhere, expect single-tenant / working-renter base with shorter leases; 68% free/reduced lunch — lower-income household profile, screen leases tightly.
- Zoned schools: Flat Lick Elementary School (math 22% / reading 52%, grade F, #255 of 676 statewide, top 42%, 190 students, 86% FRL); Knox County Middle School (math 17% / reading 42%, grade F, #151 of 217 statewide, top 71%, 429 students, 81% FRL); Knox Central High School (math 17% / reading 22%, grade F, #213 of 254 statewide, top 86%, 761 students, 78% FRL).
- Watch-outs: flood insurance adds $56/mo.
- Market conditions: 47 active listings in the ZIP.
- Knox County population projected at -16% by 2050 — secular population decline; favor cash flow + early exit over multi-decade hold.
- At projected returns (3.8% appreciation + 3.0% rent growth), your $15k cash investment doubles in ~3 years — after that, you're playing with house money.
- Climate carrying-cost: severe flood risk; severe wildfire risk — expect insurance premiums to compound above CPI over the hold.
- Cap rate 12.5% vs local median 3.1% in Barbourville — top-decile yield for the area; either an underpriced asset or a hidden risk that comps aren't pricing in. Stress-test before assuming the spread holds.
Questions for listing agent
- Have any recent inspections been done? Can we get a copy of the seller's disclosures and any deferred-maintenance estimates?
- What's the actual annual flood-insurance premium (NFIP or private), and is the property in a SFHA with mandatory coverage?
- Is there a deadline driving the sale (1031 exchange, divorce, estate, relocation)? That informs how much negotiation room exists.
- What's the average days-on-market for RENTAL listings here right now (not sales)? A rising rental-DOM trend means longer vacancies and softer asking-rent achievability than the comps imply.
- What's the recent tenant-quality profile in this submarket — average credit score on applications, eviction rate, late-payment / NSF rate, and stable-employment percentage? A property-management company in the area should have these aggregated.
- How much new for-sale + rental construction is in the pipeline within 1–3 miles? Heavy new supply typically softens prices + rents 12–24 months out; constrained supply supports both.
Repairs flagged (vision-AI assessment)
- Major: siding — Significant wear and tear
- Major: exterior paint — Faded and peeling
- Major: landscaping — Overgrown lawn
CashFlowRE · CFR-85N98486FMDRWJ
· Data 2 days ago
cashflowre.app · 2026-05-29