32 Cr-1143a Dear Born Dr · Barbourville, KY
Flood risk 9/10 · Severe
- FEMA flood zone
- X (unshaded)
- Chance of flooding over 30 yrs
- 0.99%
- Est. flood insurance / yr
- $473 – $860
Fire risk 9/10 · Severe
- Est. fire insurance / yr
- $839 – $1,559
Heat risk 4/10 · Minor
- Hot days now (above 101°F)
- 7 days/yr
- Hot days in 30 yrs
- 21 days/yr
Wind risk 2/10 · Minimal
- Chance of severe wind over 30 yrs
- 3.0%
Air-quality risk 1/10 · Minimal
- Unhealthy air days now
- 0 days/yr
- Unhealthy air days in 30 yrs
- 0 days/yr
Risk factors via First Street. Map © Google.
Why this score? — see what drove the B grade
The composite is a weighted blend of 9 inputs, each scored 0–100. Each bar is that input's sub-score; the figure is the points it added to the 100-point composite (weight × sub-score).
- Cash flow +30.0/30.0
- 1% rule +10.0/10.0
- DSCR +10.0/10.0
- ARV discount +7.5/15.0
- Appreciation +6.9/10.0
- Livability +3.2/5.0
- Rent growth +2.5/5.0
- Schools +2.5/10.0
- Condition / age +2.2/5.0
$55,000
🖨 Deal sheet 📄 Offer letter ✓ Due diligence
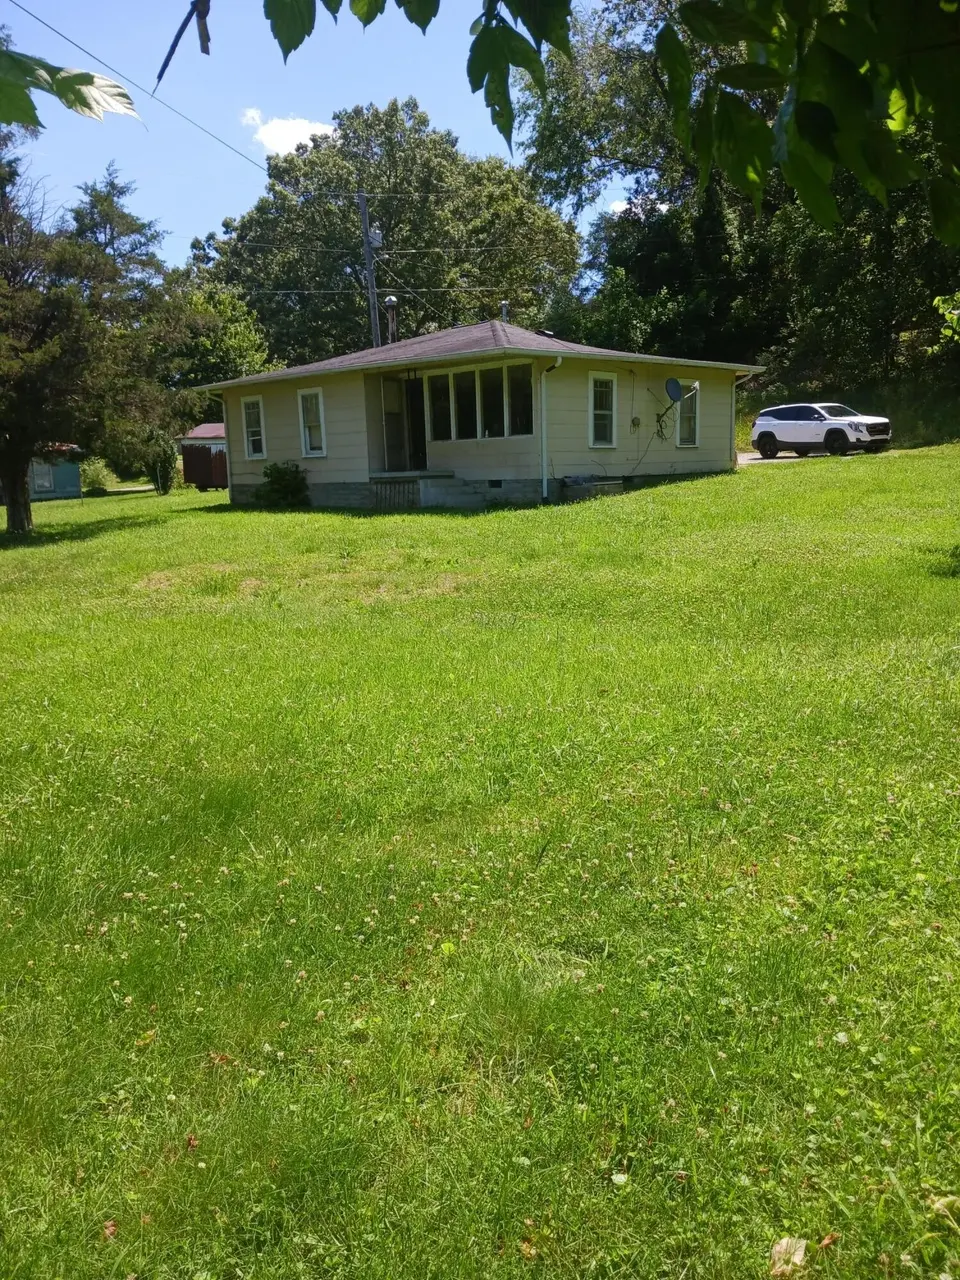
Listing remarks
Cozy home sitting on mostly level lot located at end of street with no thru traffic. woods behind the home gives privacy. Front view is fields and trees. KU electric and public water company.
Key facts
- Front view fields
- No thru traffic
- Level lot
Tags
Property features AI
Exterior
- Parking: Driveway; Off-street parking
- Utilities: Public water; Septic tank; Electricity available; Natural gas available; Water connected
- Home design: House; One level
- Construction: Block foundation; Shingle roof; Other construction materials; Built area approximately 900
- Exterior features: Shed(s); Partial fencing; Few trees on the lot; Rural view
Interior
- Kitchen: Gas range; Refrigerator
- Flooring: Ceramic tile; Laminate; Vinyl
- Bathrooms: 1 full bathroom
- Heating & cooling: Floor furnace (heating)
- Interior features: Gas range; Refrigerator; Four total rooms; Crawl space basement; No fireplace
Neighborhood map
What this means for you Summary
Snapshot
- This is a 2-bed/1.0-bath single-family listed at $55k. Condition is rated fair.
Deal economics
- At list price, monthly cash flow is $230 ($3k/yr) — positive.
- The deal already cash-flows at list — no discount required.
- Meets the 1% rule at list price ($843 rent vs $55k).
- Cap rate 12.5% vs local median 3.1% in Barbourville — top-decile yield for the area; either an underpriced asset or a hidden risk that comps aren't pricing in. Stress-test before assuming the spread holds.
Location & tenants
- Location reads 64/100 on livability (#284 in KY) — a middle-class / working-renter tenant base. Strengths: cost of living A+, crime A-, housing B; Watch: amenities F, commute F, employment F.
- Knox County (town): math 24% / reading 38% proficiency, ranked #116 of 165 in KY (top 70%) — families likely to look elsewhere, expect single-tenant / working-renter base with shorter leases; 68% free/reduced lunch — lower-income household profile, screen leases tightly.
- Zoned schools: Flat Lick Elementary School (math 22% / reading 52%, grade F, #255 of 676 statewide, top 42%, 190 students, 86% FRL); Knox County Middle School (math 17% / reading 42%, grade F, #151 of 217 statewide, top 71%, 429 students, 81% FRL); Knox Central High School (math 17% / reading 22%, grade F, #213 of 254 statewide, top 86%, 761 students, 78% FRL).
- Market conditions: 47 active listings in the ZIP.
Forward outlook
- In year one you build about $2k of equity ($380 loan paydown + $2k appreciation (3.8% local appreciation)).
- Knox County population projected at -16% by 2050 — secular population decline; favor cash flow + early exit over multi-decade hold.
- At projected returns (3.8% appreciation + 3.0% rent growth), your $15k cash investment doubles in ~3 years — after that, you're playing with house money.
Negotiation context
- Only 9 days on market — expect competitive offers; lowballing is unlikely to land.
Risks & watch-outs
- Watch-outs: flood insurance adds $56/mo.
- Climate carrying-cost: severe flood risk; severe wildfire risk — expect insurance premiums to compound above CPI over the hold.
Questions for the listing agent
- Have any recent inspections been done? Can we get a copy of the seller's disclosures and any deferred-maintenance estimates?
- What's the actual annual flood-insurance premium (NFIP or private), and is the property in a SFHA with mandatory coverage?
- Is there a deadline driving the sale (1031 exchange, divorce, estate, relocation)? That informs how much negotiation room exists.
- What's the average days-on-market for RENTAL listings here right now (not sales)? A rising rental-DOM trend means longer vacancies and softer asking-rent achievability than the comps imply.
- What's the recent tenant-quality profile in this submarket — average credit score on applications, eviction rate, late-payment / NSF rate, and stable-employment percentage? A property-management company in the area should have these aggregated.
- How much new for-sale + rental construction is in the pipeline within 1–3 miles? Heavy new supply typically softens prices + rents 12–24 months out; constrained supply supports both.
Investment metrics
- 1% rule
- 1.53% ✓
- Cap rate
- 12.52%
- Cash-on-cash
- 22.26%
- DSCR
- 1.99
- GRM
- 5.4
CMA / ARV
No comps found within radius.
Projected returns pro-forma
3.84% appreciation · 3.0% rent growth · sell at horizon
- IRR
- 26.1%
- Equity multiple
- 2.55×
- Total profit
- $23,801
- Equity at exit
- $27,363
- IRR
- 26.1%
- Equity multiple
- 4.98×
- Total profit
- $61,311
- Equity at exit
- $44,341
Cash invested: $15,400 (down + closing). Projections, not guarantees.
Landlord ↔ Tenant lean methodology
- Overall (STATE)
- 83 Strongly Landlord-Friendly
- State Kentucky
- 83 Strongly Landlord-Friendly · R+16
- County
- — inherits STATE
- City
- — inherits STATE
ZIP-level market 40906
- Home prices YoY
- 2.2%
- Active inventory
- 47
- Price-to-rent
- 5.4×
Monthly cashflow live
- Estimated rent
- $843 medium interval (Pro) →
- Mortgage (P&I)
- −$288
- Tax est. 1.5%
- −$69 /mo · $825/yr
- Insurance
- −$23
- Flood insurance flood zone
- −$56 /mo · $666/yr
- HOA
- −$0
- Vacancy / Maint / Mgmt
- −$177
- Net cashflow
- $230
Break-even live
UW: 25.0% down · 7.5% · 30yr · 1.5% tax · 5.0% vac · 8.0% maint · 8.0% mgmt
Financing live
Cash to close
- Down payment
- $13,750
- Closing costs
- $1,650
- Reserves months
- —
- Total cash needed
- —
Loan-product check · same deal, 3 products live
Conventional
25% down · 7.5% · 30yr
- Down + closing
- —
- Monthly P&I
- —
- Monthly cashflow
- —
- DSCR
- —
- Eligible?
- —
Personal DTI + credit; lowest rate.
DSCR
20% down · 8.5% · 30yr
- Down + closing
- —
- Monthly P&I
- —
- Monthly cashflow
- —
- DSCR
- —
- Eligible?
- —
No personal income docs; deal must DSCR.
Hard money
10% down · 12.0% · 12mo
- Down + closing
- —
- Monthly P&I
- —
- Monthly cashflow
- —
- DSCR
- —
- Eligible?
- —
Short-term bridge; refi at stabilization.
Listing history 8 events
-
2026-06-18days on market $55,000 Active 9 DOM
-
2026-06-17days on market $55,000 Active 8 DOM
-
2026-06-16days on market $55,000 Active 7 DOM
-
2026-06-15days on market $55,000 Active 6 DOM
-
2026-06-13days on market $55,000 Active 4 DOM
-
2026-06-12days on market $55,000 Active 3 DOM
-
2026-06-09remarks 191-char remark
-
2026-06-09$55,000 Active 1 DOM
ⓘ Source: listings_history table (triggers on properties + properties_extension) + one-shot
backfill from property_details.listing_events for pre-trigger history.
Climate risk First Street
- Flood 9/10 Extreme FEMA zone X (unshaded) · 99% chance over 30 yrs
- Wildfire 9/10 Extreme
- Heat 4/10 Moderate 7 d/yr ≥101°F today · 21 d/yr by 30 yrs out
- Wind 2/10 Low 3% chance of damaging wind over 30 yrs
- Air quality 1/10 Low 0 unhealthy d/yr today · 0 by 30 yrs out
Nearby sold comps map
Loading sold comps map…
Walkable amenities ~0.75 mi
Loading nearby amenities…
Taxation est. · year 1
- Rental income
- $10,112
- − Mortgage interest
- −$3,081
- − Property taxes
- −$825
- − Insurance
- −$942
- − Repairs & maintenance
- −$809
- − Management
- −$809
- − Depreciation
- −$1,600
- Taxable income
- $2,047
- Est. tax owed @ 24.0%
- −$491
- After-tax cash flow
- $2,270/yr
For passive investors: Depreciation is non-cash, so a rental often shows a tax loss while cash-flowing — sheltering income. Rental losses are passive: they offset passive income freely, and up to $25,000/yr can offset ordinary (W-2) income if you actively participate and your MAGI is under $100k (phasing out to $0 by $150k); unused losses carry forward. On sale, claimed depreciation is recaptured at up to 25%, and gains may owe capital-gains tax (a 1031 exchange can defer both). Figures are a year-1 estimate at your 24.0% rate — not tax advice; consult a CPA.
Condition & rehab AI · 12 photos
This home requires moderate renovations to improve its exterior and curb appeal, which would significantly increase its resale and rental value.
Repairs flagged
- Major siding — Significant wear and tear
- Major exterior paint — Faded and peeling
- Major landscaping — Overgrown lawn
Value-add opportunities
- Both paint interior walls — Fresh paint enhances curb appeal and interior aesthetics
- Both repair and paint exterior siding — Fresh siding and paint improve curb appeal and home value
- Both landscaping and lawn care — A well-maintained lawn and landscaping boost curb appeal and attract potential buyers
Renovation cost estimate screening
| Repair item | Severity | Est. cost |
|---|---|---|
| siding · Significant wear and tear | Major | $15,000–50,000 |
| exterior paint · Faded and peeling | Major | $15,000–50,000 |
| landscaping · Overgrown lawn | Major | $15,000–50,000 |
| Total estimated repair cost · 3 items | $45,000–150,000 |
Value-add ROI direction
- Both paint interior walls — Fresh paint enhances curb appeal and interior aesthetics ↑
- Both repair and paint exterior siding — Fresh siding and paint improve curb appeal and home value ↑
- Both landscaping and lawn care — A well-maintained lawn and landscaping boost curb appeal and attract potential buyers ↑
ⓘ Cost ranges are severity-bucket heuristics (US national rule-of-thumb). Get contractor quotes + a written scope before underwriting a rehab budget.
Schools (NCES district)
- District
- Knox County
- NCES district ID
- 2103150
- Math proficiency
- 24% ▼ -20.00%
- Reading proficiency
- 38% ▼ -19.00%
- Median HH income
- $24,965
- Composite
- 24.59/100
- National rank
- #7636
- State rank
- #116 of 165 in KY
Livability — Barbourville
- Score
- 64/100
- State rank
- #284
- US rank
- #13792
Category grades
Schools grade is shown separately in the Schools card above.
Census & demographics
- Population (ZIP)
- 10,560
Population outlook (Knox County) Hauer SSP2
- Today (2025)
- 30,741 people
- By 2030
- 29,887 · -2.8%
- By 2040
- 27,940 · -9.1%
- By 2050
- 25,826 · -16.0%
- By 2075
- 20,895 · -32.0%
- By 2100
- 16,238 · -47.2%
Race, ethnicity, and origin ACS 2023
- Neighborhood character
- Predominantly White (96%)
- Race & ethnicity
- White 96% Black 2% Two or more races 1%
- Common ancestry
- Serbian 1% Iranian 1% Slovak 1%
- Foreign-born
- 0%
- Languages at home
- 99% English-only · Spanish 1%
Political lean MEDSL · Knox
- 2024 margin
- Solid R (+71.1) · D 13.8% · R 85.0% · Other 1.2%
- 2008→2024 swing
- -26.6pp toward R · 2008: -44.6pp · 2024: -71.1pp
- All cycles
- 2024: R+71.1 2020: R+67.0 2016: R+67.7 2012: R+53.9 2008: R+44.6
Not yet ingested
- Civics
- —
Market trends
- HPI YoY
- ▲ 3.84%
- Current HPI
- 180.8175
- Rent YoY
- —
- Metro
- —
- State GDP YoY
- ▲ 1.81%
- F500 in state
- 4
Industry mix (Fortune 500 HQ in KY)
| Industry | F500 HQs | Revenue |
|---|---|---|
| Healthcare | 1 | $118B |
|
||
| Food / Beverage | 1 | $7B |
|
||
Price history
1 event — show timeline
- 2026-06-07 Listed $55,000 ImagineMLS
Cash-flow waterfall
monthlySold comps — $/sqft
last 12 mo · ≤1 miLoading sold comps…