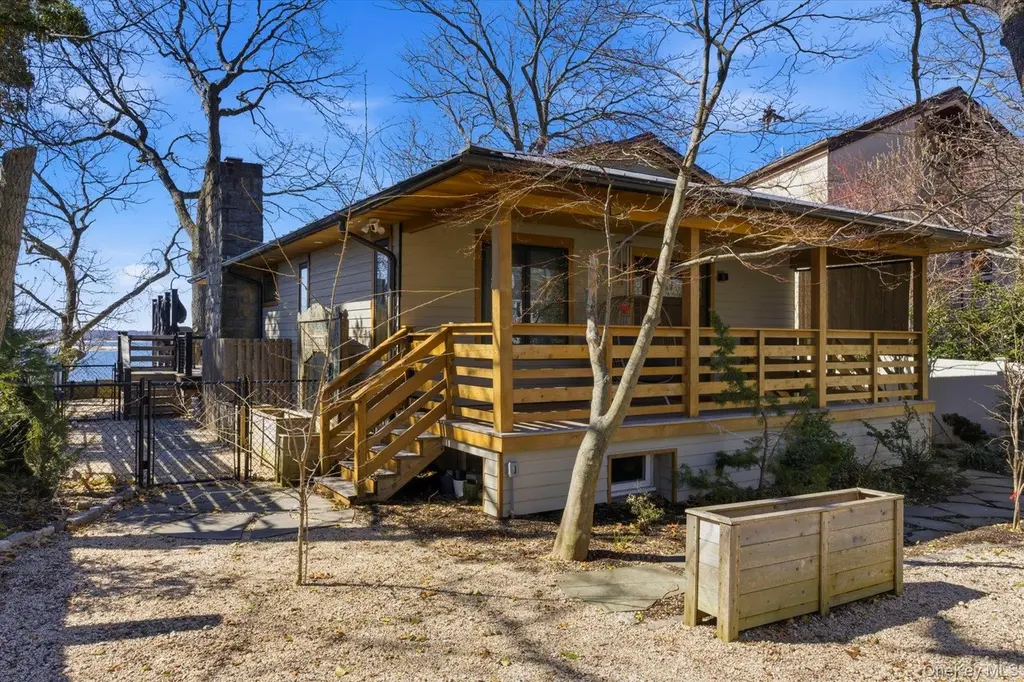
154 Eatons Neck Rd
Eatons Neck, NY 11768
$1,499,999D+
2 bd · 2.0 ba ·
1,869 sqft ·
Built 1973
· SingleFamily
· Pending
· 16 DOM
Cashflow @ list (25.0% down · 7.5%)
Estimated rent
$12,000/mo
Mortgage (P&I)
−$7,866
Tax + insurance
−$1,850
HOA
−$0
Vac / Maint / Mgmt
−$2,520
Net cashflow
$-236/mo
Annual
$-2,837/yr
Cap rate
6.10%
Cash-on-cash
-0.68%
DSCR
0.97
1% rule
0.80%
Cash to close
$420,000
Investor read
- This is a 2-bed/2.0-bath single-family listed at $1.50M.
- At list price, monthly cash flow is $-236 ($-3k/yr) — negative.
- To cash-flow at today's rent, offer at most $1.46M (2.8% below list).
- To meet the 1% rule (rent ≥ 1% of price), the offer needs to be $1.20M (20.0% below list).
- It's been on market 16 days — a 2% lower offer ($1.48M) is reasonable based on typical stale-listing flexibility.
- Recommended offer: $1.20M (20.0% below list) — sets the bar for 1% rule.
- Local home prices are declining (-3.0%/yr); year-one equity from $10k of loan paydown is wiped out by about $45k of value loss. Plan a longer hold.
- Location reads 61/100 on livability (#910 in NY) — a middle-class / working-renter tenant base. Strengths: crime A+, employment A+, housing A+; Watch: amenities F, commute F, cost of living F.
- Northport-East Northport Union Free School District (suburban): math 74% / reading 65% proficiency, ranked #101 of 590 in NY (top 17%) — acceptable for families but not a draw, mixed tenant base, ~2y average lease; only 7% free/reduced lunch — higher-income household profile.
- Zoned schools: Norwood Avenue School (math 77% / reading 72%, grade A, #314 of 2,108 statewide, top 17%, 434 students, 15% FRL); Northport Middle School (math 57% / reading 62%, grade B, #161 of 729 statewide, top 24%, 700 students, 13% FRL); Northport Senior High School (math 97% / reading 62%, grade A-, #518 of 1,100 statewide, top 51%, 1,645 students, 18% FRL).
- Market conditions: 141 active listings in the ZIP; 1 comparable units currently listed for rent nearby; 1,366 units permitted in Suffolk County in 2024 (216 in 5+ unit buildings).
- Suffolk County population projected to shrink 5% by 2050 — rents likely to lag national; underwrite the cash flow, not the appreciation.
- 4 sale attempts since 8y ago with the ask held roughly flat each time — persistent listings suggest the price (not the market) is what's stuck; bring a comps-based counter.
- Current owner paid $700k; list at $1.50M implies a 114% gain — meaningful room to come down on a strong offer.
- Climate carrying-cost: severe wind risk, 80% chance of damaging wind over 30y; extreme-heat days projected 7→15/yr by 2055 (HVAC capex compounding) — expect insurance premiums to compound above CPI over the hold.
Questions for listing agent
- What do current leases actually rent for vs. the listed asking? Can we see a recent rent roll and the last 12 months of T-12 income?
- Built in 1973 — when were the roof, HVAC, electrical panel, plumbing, and water heater last replaced?
- Is there a deadline driving the sale (1031 exchange, divorce, estate, relocation)? That informs how much negotiation room exists.
- The area grade is low — what's the realistic commute time and amenity access for the typical tenant pool here? Any planned neighborhood developments (good or bad) we should know about?
- What's the average days-on-market for RENTAL listings here right now (not sales)? A rising rental-DOM trend means longer vacancies and softer asking-rent achievability than the comps imply.
- What's the recent tenant-quality profile in this submarket — average credit score on applications, eviction rate, late-payment / NSF rate, and stable-employment percentage? A property-management company in the area should have these aggregated.
- How much new for-sale + rental construction is in the pipeline within 1–3 miles? Heavy new supply typically softens prices + rents 12–24 months out; constrained supply supports both.
CashFlowRE · CFR-85RCDM2A4W5E7N
· Data 3 weeks ago
cashflowre.app · 2026-05-29