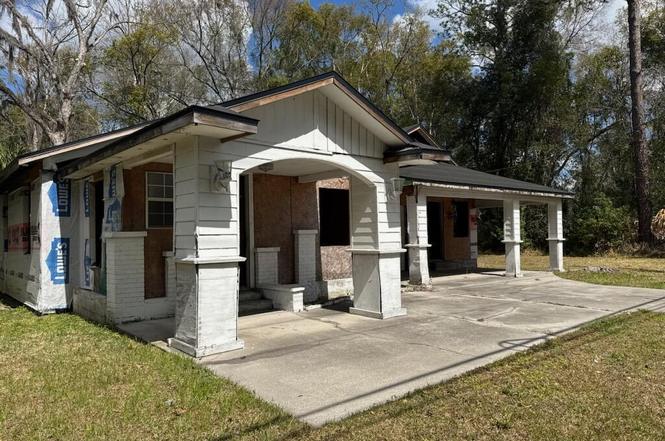
541 Us Highway 90 E
Baldwin, FL 32234
$100,000B
3 bd · 2.0 ba ·
1,630 sqft ·
Built 1949
· SingleFamily
· Active
· 78 DOM
Cashflow @ list (25.0% down · 7.5%)
Estimated rent
$1,995/mo
Mortgage (P&I)
−$524
Tax + insurance
−$102
HOA
−$0
Vac / Maint / Mgmt
−$419
Net cashflow
$950/mo
Annual
$11,394/yr
Cap rate
17.69%
Cash-on-cash
40.69%
DSCR
2.81
1% rule
2.00%
Cash to close
$28,000
Investor read
- This is a 3-bed/2.0-bath single-family listed at $100k.
- At list price, monthly cash flow is $950 ($11k/yr) — positive.
- The deal already cash-flows at list — no discount required.
- Meets the 1% rule at list price ($2k rent vs $100k).
- It's been on market 78 days — a 6% lower offer ($94k) is reasonable based on typical stale-listing flexibility.
- Recommended offer: $94k (6.0% below list) — sets the bar for market timing.
- In year one you build about $1k of equity ($691 loan paydown + $450 appreciation (0.5% local appreciation)).
- Location reads 67/100 on livability (#575 in FL) — a middle-class / working-renter tenant base. Strengths: crime A+, cost of living A+, housing A+; Watch: amenities F, commute F, employment F.
- Duval (urban): math 46% / reading 45% proficiency, ranked #48 of 73 in FL (top 66%) — families likely to look elsewhere, expect single-tenant / working-renter base with shorter leases.
- Zoned schools: Mamie Agnes Jones Elementary School (math 57% / reading 47%, grade C-, #990 of 2,144 statewide, top 48%, 430 students, 61% FRL); Baldwin Middle-Senior High School (math 37% / reading 39%, grade F, #328 of 667 statewide, top 50%, 1,384 students, 43% FRL) — zoned schools at 52% FRL track the district average.
- Watch-outs: built in 1949 — expect roof / HVAC / electrical / plumbing capex.
- Market conditions: 232 active listings in the ZIP; 1 comparable units currently listed for rent nearby; solid renter incomes; 6,503 units permitted in Duval County in 2024 (1,131 in 5+ unit buildings).
- Duval County population projected at +19% by 2050 — long-run rental-demand tailwind backs the buy-and-hold thesis.
- 2 sale attempts since 3y ago with the ask held roughly flat each time — persistent listings suggest the price (not the market) is what's stuck; bring a comps-based counter.
- Current owner paid $45k; list at $100k implies a 122% gain — meaningful room to come down on a strong offer.
- At projected returns (0.5% appreciation + 3.0% rent growth), your $28k cash investment doubles in ~3 years — after that, you're playing with house money.
- Climate carrying-cost: severe wind risk, 99% chance of damaging wind over 30y; severe wildfire risk; extreme-heat days projected 7→19/yr by 2055 (HVAC capex compounding) — expect insurance premiums to compound above CPI over the hold.
Questions for listing agent
- It's been on market 78 days. Have you received any prior offers? Is the seller open to a 6% concession, seller financing, or rate buy-down credit?
- Built in 1949 — when were the roof, HVAC, electrical panel, plumbing, and water heater last replaced?
- Why hasn't it sold? Are there any deal-killer items the seller is aware of (foundation, flood, title, zoning, code violations)?
- Is there a deadline driving the sale (1031 exchange, divorce, estate, relocation)? That informs how much negotiation room exists.
- What's the average days-on-market for RENTAL listings here right now (not sales)? A rising rental-DOM trend means longer vacancies and softer asking-rent achievability than the comps imply.
- What's the recent tenant-quality profile in this submarket — average credit score on applications, eviction rate, late-payment / NSF rate, and stable-employment percentage? A property-management company in the area should have these aggregated.
- How much new for-sale + rental construction is in the pipeline within 1–3 miles? Heavy new supply typically softens prices + rents 12–24 months out; constrained supply supports both.
CashFlowRE · CFR-861GTP472M312Q
· Data 3 weeks ago
cashflowre.app · 2026-05-29