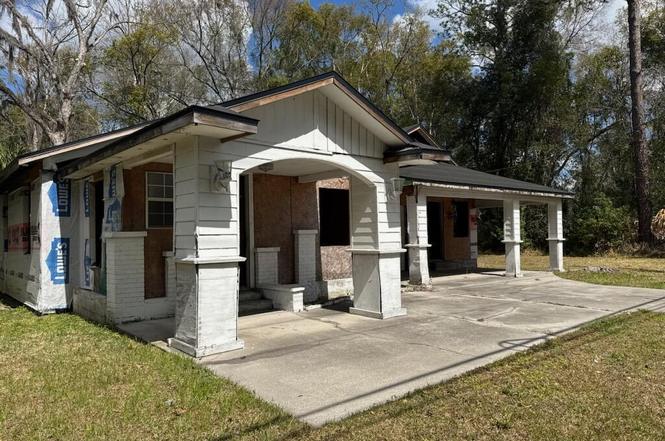
541 Us Highway 90 E · Baldwin, FL
Flood risk 1/10 · Minimal
- FEMA flood zone
- X (unshaded)
- Chance of flooding over 30 yrs
- 0.0%
- Est. flood insurance / yr
- $507 – $1,088
Fire risk 8/10 · Major
- Est. fire insurance / yr
- $947 – $1,759
Heat risk 8/10 · Major
- Hot days now (above 109°F)
- 7 days/yr
- Hot days in 30 yrs
- 19 days/yr
Wind risk 9/10 · Severe
- Chance of severe wind over 30 yrs
- 99.0%
Air-quality risk 4/10 · Minor
- Unhealthy air days now
- 6 days/yr
- Unhealthy air days in 30 yrs
- 6 days/yr
Risk factors via First Street. Map © Google.
Why this score? — see what drove the B grade
The composite is a weighted blend of 9 inputs, each scored 0–100. Each bar is that input's sub-score; the figure is the points it added to the 100-point composite (weight × sub-score).
- Cash flow +30.0/30.0
- 1% rule +10.0/10.0
- DSCR +10.0/10.0
- ARV discount +7.5/15.0
- Appreciation +5.2/10.0
- Schools +3.9/10.0
- Livability +3.4/5.0
- Rent growth +2.5/5.0
- Condition / age +2.5/5.0
$100,000
🖨 Deal sheet 📄 Offer letter ✓ Due diligence
Listing remarks
This Vacant property is ready to be build adding your own taste! More bedrooms and baths can be added! It is on a very large lot with a detached 1 car garage. The property is ready for the new owner to build and make it the way they would like it to be! Bring your offers! Seller has paid $5,000 for the house Architectural plan which restructures how to build the property with more space added by removing the car garage in the middle of the property! The architectural plan shows the property with a 2200 sqft and this will be transferred to the buyer or buyers offer that seller will accept! Buyers' agents or buyers to do due diligence. Sewer can be connected to the city; the connections are a
Key facts
- Large lot
- Detached garage
- 0.24 acre lot
Tags
Property features AI
Finance
- HOA & community: Not a senior community
Exterior
- Parking: Detached garage; 1-car garage
- Utilities: Public sewer; Other utilities
- Home design: Single-family residence; Single-story (entry level 1); East-facing
- Exterior features: City street frontage; Asphalt road surface; Lot size approximately 0.24 acres
Interior
- Kitchen: No kitchen appliances specified
- Bedrooms: 3 bedrooms (all on entry level)
- Bathrooms: 2 full bathrooms
- Heating & cooling: Cooling system present (other); No heating system specified
- Interior features: No built-in appliances listed
- Laundry & utility: Unfurnished unit (no laundry appliances specified)
Neighborhood map
What this means for you Summary
Snapshot
- This is a 3-bed/2.0-bath single-family listed at $100k.
Deal economics
- At list price, monthly cash flow is $950 ($11k/yr) — positive.
- The deal already cash-flows at list — no discount required.
- Meets the 1% rule at list price ($2k rent vs $100k).
- Recommended offer: $94k (6.0% below list) — sets the bar for market timing.
Location & tenants
- Location reads 67/100 on livability (#575 in FL) — a middle-class / working-renter tenant base. Strengths: crime A+, cost of living A+, housing A+; Watch: amenities F, commute F, employment F.
- Duval (urban): math 46% / reading 45% proficiency, ranked #48 of 73 in FL (top 66%) — families likely to look elsewhere, expect single-tenant / working-renter base with shorter leases.
- Zoned schools: Mamie Agnes Jones Elementary School (math 57% / reading 47%, grade C-, #990 of 2,144 statewide, top 48%, 430 students, 61% FRL); Baldwin Middle-Senior High School (math 37% / reading 39%, grade F, #328 of 667 statewide, top 50%, 1,384 students, 43% FRL) — zoned schools at 52% FRL track the district average.
- Market conditions: 232 active listings in the ZIP; 1 comparable units currently listed for rent nearby; solid renter incomes; 6,503 units permitted in Duval County in 2024 (1,131 in 5+ unit buildings).
Forward outlook
- In year one you build about $1k of equity ($691 loan paydown + $450 appreciation (0.5% local appreciation)).
- Duval County population projected at +19% by 2050 — long-run rental-demand tailwind backs the buy-and-hold thesis.
- At projected returns (0.5% appreciation + 3.0% rent growth), your $28k cash investment doubles in ~3 years — after that, you're playing with house money.
Negotiation context
- It's been on market 78 days — a 6% lower offer ($94k) is reasonable based on typical stale-listing flexibility.
- 2 sale attempts since 3y ago with the ask held roughly flat each time — persistent listings suggest the price (not the market) is what's stuck; bring a comps-based counter.
- Current owner paid $45k; list at $100k implies a 122% gain — meaningful room to come down on a strong offer.
Risks & watch-outs
- Watch-outs: built in 1949 — expect roof / HVAC / electrical / plumbing capex.
- Climate carrying-cost: severe wind risk, 99% chance of damaging wind over 30y; severe wildfire risk; extreme-heat days projected 7→19/yr by 2055 (HVAC capex compounding) — expect insurance premiums to compound above CPI over the hold.
Questions for the listing agent
- It's been on market 78 days. Have you received any prior offers? Is the seller open to a 6% concession, seller financing, or rate buy-down credit?
- Built in 1949 — when were the roof, HVAC, electrical panel, plumbing, and water heater last replaced?
- Why hasn't it sold? Are there any deal-killer items the seller is aware of (foundation, flood, title, zoning, code violations)?
- Is there a deadline driving the sale (1031 exchange, divorce, estate, relocation)? That informs how much negotiation room exists.
- What's the average days-on-market for RENTAL listings here right now (not sales)? A rising rental-DOM trend means longer vacancies and softer asking-rent achievability than the comps imply.
- What's the recent tenant-quality profile in this submarket — average credit score on applications, eviction rate, late-payment / NSF rate, and stable-employment percentage? A property-management company in the area should have these aggregated.
- How much new for-sale + rental construction is in the pipeline within 1–3 miles? Heavy new supply typically softens prices + rents 12–24 months out; constrained supply supports both.
Investment metrics
- 1% rule
- 2.00% ✓
- Cap rate
- 17.69%
- Cash-on-cash
- 40.69%
- DSCR
- 2.81
- GRM
- 4.2
CMA / ARV
- ARV (on-the-fly)
- $298,290
- Comps found
- 7
Show comp detail 7 sales within ~0.75 mi
| Address | Dist | Beds/Ba | Sqft | Sold | Price | $/sf | Match |
|---|---|---|---|---|---|---|---|
| 34 Delmonte St | 0.03mi | 3/2.0 | 1,400 (-14%) | 1mo | $275,000 | $196 | 74 |
| 225 Monterey Blvd | 0.12mi | 3/2.5 | 1,725 (+6%) | 15mo | $230,000 | $133 | 70 |
| 860 Center St N | 0.48mi | 4/2.0 (+1) | 1,608 (-1%) | 5mo | $299,900 | $187 | 66 |
| 265 Murray St N | 0.30mi | 3/2.5 | 1,658 (+2%) | 22mo | $329,599 | $199 | 63 |
| 858 Center St N | 0.48mi | 4/2.0 (+1) | 1,608 (-1%) | 11mo | $295,000 | $183 | 61 |
| 856 Center St N | 0.47mi | 4/2.0 (+1) | 1,739 (+7%) | 11mo | $299,900 | $172 | 53 |
| 380 Palm Ave | 0.62mi | 3/2.0 | 1,874 (+15%) | 8mo | $275,000 | $147 | 40 |
Match score weights: distance 35% · size 25% · config 20% · recency 20%. Top-matched comps best support the ARV.
Projected returns pro-forma
0.45% appreciation · 3.0% rent growth · sell at horizon
- IRR
- 42.4%
- Equity multiple
- 3.13×
- Total profit
- $59,676
- Equity at exit
- $31,308
- IRR
- 44.9%
- Equity multiple
- 6.19×
- Total profit
- $145,378
- Equity at exit
- $39,498
Cash invested: $28,000 (down + closing). Projections, not guarantees.
Landlord ↔ Tenant lean methodology
- Overall (STATE)
- 87 Strongly Landlord-Friendly
- State Florida
- 87 Strongly Landlord-Friendly · R+3
- County
- — inherits STATE
- City
- — inherits STATE
ZIP-level market 32234
- Home prices YoY
- 0.2%
- Active inventory
- 232
- Price-to-rent
- 4.2×
Monthly cashflow live
- Estimated rent
- $1,995 medium interval (Pro) →
- Mortgage (P&I)
- −$524
- Tax from tax record
- −$61 /mo · $727/yr
- Insurance
- −$42
- HOA
- −$0
- Vacancy / Maint / Mgmt
- −$419
- Net cashflow
- $950
Break-even live
UW: 25.0% down · 7.5% · 30yr · 1.5% tax · 5.0% vac · 8.0% maint · 8.0% mgmt
Financing live
Cash to close
- Down payment
- $25,000
- Closing costs
- $3,000
- Reserves months
- —
- Total cash needed
- —
Loan-product check · same deal, 3 products live
Conventional
25% down · 7.5% · 30yr
- Down + closing
- —
- Monthly P&I
- —
- Monthly cashflow
- —
- DSCR
- —
- Eligible?
- —
Personal DTI + credit; lowest rate.
DSCR
20% down · 8.5% · 30yr
- Down + closing
- —
- Monthly P&I
- —
- Monthly cashflow
- —
- DSCR
- —
- Eligible?
- —
No personal income docs; deal must DSCR.
Hard money
10% down · 12.0% · 12mo
- Down + closing
- —
- Monthly P&I
- —
- Monthly cashflow
- —
- DSCR
- —
- Eligible?
- —
Short-term bridge; refi at stabilization.
Rent comps 1 comps
| Address | Beds | Baths | Sqft | Rent | $/sqft | DOM | Units | Dist |
|---|---|---|---|---|---|---|---|---|
| 55 Delmonte St Unit NA Baldwin, FL | 3.0 | 2.0 | 1400 | $1,969 | $1.41 | 4d | 1 | 0.03mi |
Listing history 10 events
-
2026-03-10$100,000 Active
-
2023-03-28soldstatus $45,000
-
2023-03-02historical
-
2023-02-28price $55,000
-
2023-02-10historical
-
2023-02-04price $60,000
-
2023-02-01price $65,000
-
2023-01-25price $70,000
-
2023-01-20price $75,000
-
2023-01-17$80,000 Active
ⓘ Source: listings_history table (triggers on properties + properties_extension) + one-shot
backfill from property_details.listing_events for pre-trigger history.
Tax reassessment forecast FL · Resets to sale price
- Current annual tax
- $727 · $61/mo
- Projected year-2 tax
- $830 · $69/mo
- Expected delta
- +$103/yr (+$9/mo · 14.1%)
ⓘ Screening estimate from a state-policy table — verify with the county assessor before closing.
Climate risk First Street
- Flood 1/10 Low FEMA zone X (unshaded) · 0% chance over 30 yrs
- Wildfire 8/10 Severe
- Heat 8/10 Severe 7 d/yr ≥109°F today · 19 d/yr by 30 yrs out
- Wind 9/10 Extreme 99% chance of damaging wind over 30 yrs
- Air quality 4/10 Moderate 6 unhealthy d/yr today · 6 by 30 yrs out
Nearby sold comps map
Loading sold comps map…
Walkable amenities ~0.75 mi
Loading nearby amenities…
Taxation est. · year 1
- Rental income
- $23,942
- − Mortgage interest
- −$5,602
- − Property taxes
- −$727
- − Insurance
- −$500
- − Repairs & maintenance
- −$1,915
- − Management
- −$1,915
- − Depreciation
- −$2,909
- Taxable income
- $10,374
- Est. tax owed @ 24.0%
- −$2,490
- After-tax cash flow
- $8,905/yr
For passive investors: Depreciation is non-cash, so a rental often shows a tax loss while cash-flowing — sheltering income. Rental losses are passive: they offset passive income freely, and up to $25,000/yr can offset ordinary (W-2) income if you actively participate and your MAGI is under $100k (phasing out to $0 by $150k); unused losses carry forward. On sale, claimed depreciation is recaptured at up to 25%, and gains may owe capital-gains tax (a 1031 exchange can defer both). Figures are a year-1 estimate at your 24.0% rate — not tax advice; consult a CPA.
Schools (NCES district)
- District
- Duval
- NCES district ID
- 1200480
- Math proficiency
- 46% ▼ -11.00%
- Reading proficiency
- 45% ▼ -4.00%
- Median HH income
- $48,987
- Composite
- 38.97/100
- National rank
- #4076
- State rank
- #48 of 73 in FL
Livability — Baldwin
- Score
- 67/100
- State rank
- #575
- US rank
- #10929
Category grades
Schools grade is shown separately in the Schools card above.
Census & demographics
- Census place
- Baldwin, FL
- County
- Duval County · 1,015,274 people
- Metro
- Jacksonville, FL
- Population (ZIP)
- 9,678
- Household income
- $87,331
- Rent vs Own
- Severe rent burden
- 62.0
Population outlook (Duval County) Hauer SSP2
- Today (2025)
- 1,013,010 people
- By 2030
- 1,059,228 · +4.6%
- By 2040
- 1,141,439 · +12.7%
- By 2050
- 1,205,258 · +19.0%
- By 2075
- 1,324,282 · +30.7%
- By 2100
- 1,319,620 · +30.3%
Race, ethnicity, and origin ACS 2023
- Neighborhood character
- Predominantly White (76%)
- Race & ethnicity
- White 76% Black 16% Hispanic / Latino 6% Two or more races 4%
- Hispanic origin (detail)
- Mexican 1% Puerto Rican 2% Salvadoran 1%
- Common ancestry
- Serbian 2% Lithuanian 1% Slovak 1%
- Foreign-born
- 4% · Canada, Dominican Republic
- Languages at home
- 95% English-only · Spanish 4%
Political lean MEDSL · Duval
- 2024 margin
- Toss-up / Even · D 48.7% · R 50.1% · Other 1.2%
- 2008→2024 swing
- +0.4pp no change · 2008: -1.9pp · 2024: -1.5pp
- All cycles
- 2024: R+1.5 2020: D+3.8 2016: R+1.5 2012: R+3.6 2008: R+1.9
Not yet ingested
- Civics
- —
Market trends
- HPI YoY
- ▲ 0.45%
- Current HPI
- 288.4613
- Rent YoY
- —
- Metro
- Jacksonville, FL
- State GDP YoY
- ▲ 3.28%
- F500 in state
- 36
Industry mix (Fortune 500 HQ in FL)
| Industry | F500 HQs | Revenue |
|---|---|---|
| Industrial Technology | 2 | $29B |
|
||
| Insurance | 2 | $17B |
|
||
| Retail | 1 | $60B |
|
||
| Technology Distribution | 1 | $58B |
|
||
| Homebuilding | 1 | $35B |
|
||
| Technology Manufacturing | 1 | $35B |
|
||
Price history
+25.0% since first listed10 events — show timeline
- 2026-03-10 Listed $100,000 realMLS
- 2023-03-28 Sold (Public Records) $45,000 Public Records
- 2023-03-02 Listing Removed — realMLS
- 2023-02-28 Price Changed $55,000 realMLS
- 2023-02-10 Listing Removed — realMLS
- 2023-02-04 Price Changed $60,000 realMLS
- 2023-02-01 Price Changed $65,000 realMLS
- 2023-01-25 Price Changed $70,000 realMLS
- 2023-01-20 Price Changed $75,000 realMLS
- 2023-01-17 Listed $80,000 realMLS
Property tax history
+1.5%/yrLatest (2025): $727 · +21.5% YoY. Source: county tax records.
Cash-flow waterfall
monthlySold comps — $/sqft
last 12 mo · ≤1 miLoading sold comps…