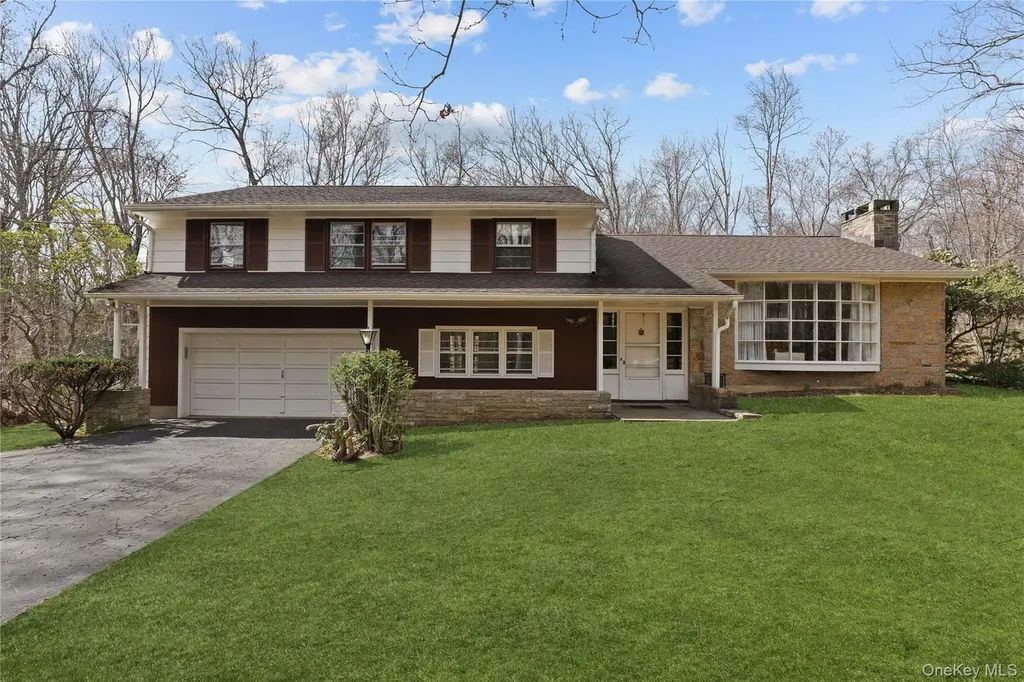
15 Laurel Rd
Scotts Corners, NY 10576
$789,000C
4 bd · 2.5 ba ·
2,274 sqft ·
Built 1958
· SingleFamily
· Pending
· 19 DOM
Cashflow @ list (25.0% down · 7.5%)
Estimated rent
$6,606/mo
Mortgage (P&I)
−$4,138
Tax + insurance
−$670
HOA
−$0
Vac / Maint / Mgmt
−$1,387
Net cashflow
$411/mo
Annual
$4,932/yr
Cap rate
6.92%
Cash-on-cash
2.23%
DSCR
1.10
1% rule
0.84%
Cash to close
$220,920
Investor read
- This is a 4-bed/2.5-bath single-family listed at $789k.
- At list price, monthly cash flow is $411 ($5k/yr) — positive.
- The deal already cash-flows at list — no discount required.
- To meet the 1% rule (rent ≥ 1% of price), the offer needs to be $661k (16.3% below list).
- It's been on market 19 days — a 2% lower offer ($777k) is reasonable based on typical stale-listing flexibility.
- Recommended offer: $661k (16.3% below list) — sets the bar for 1% rule.
- In year one you build about $36k of equity ($5k loan paydown + $30k appreciation (3.8% local appreciation)).
- Location reads 63/100 on livability (#810 in NY) — a middle-class / working-renter tenant base. Strengths: crime A+, employment A+, housing B+; Watch: schools C-, amenities F, commute F.
- Bedford Central School District (rural): math 54% / reading 60% proficiency, ranked #211 of 590 in NY (top 36%) — acceptable for families but not a draw, mixed tenant base, ~2y average lease; only 10% free/reduced lunch — higher-income household profile.
- Watch-outs: built in 1958 — expect roof / HVAC / electrical / plumbing capex.
- Market conditions: 69 active listings in the ZIP; 2 comparable units currently listed for rent nearby; 954 units permitted in Westchester County in 2024 (649 in 5+ unit buildings).
- Westchester County population projected at +10% by 2050 — modest demand growth; plan on rents tracking national, not racing it.
- At projected returns (3.8% appreciation + 3.0% rent growth), your $221k cash investment doubles in ~5 years — after that, you're playing with house money.
- By year 2, paydown + projected appreciation supports a ~$58k cash-out refi (75% LTV) — recoverable capital for the next deal without selling this one.
- Climate carrying-cost: major wind risk, 27% chance of damaging wind over 30y — expect insurance premiums to compound above CPI over the hold.
- Cap rate 6.9% vs local median 2.6% in Scotts Corners — top-decile yield for the area; either an underpriced asset or a hidden risk that comps aren't pricing in. Stress-test before assuming the spread holds.
Questions for listing agent
- Built in 1958 — when were the roof, HVAC, electrical panel, plumbing, and water heater last replaced?
- Is there a deadline driving the sale (1031 exchange, divorce, estate, relocation)? That informs how much negotiation room exists.
- What's the average days-on-market for RENTAL listings here right now (not sales)? A rising rental-DOM trend means longer vacancies and softer asking-rent achievability than the comps imply.
- What's the recent tenant-quality profile in this submarket — average credit score on applications, eviction rate, late-payment / NSF rate, and stable-employment percentage? A property-management company in the area should have these aggregated.
- How much new for-sale + rental construction is in the pipeline within 1–3 miles? Heavy new supply typically softens prices + rents 12–24 months out; constrained supply supports both.
CashFlowRE · CFR-868A6M3DX89RVP
· Data 3 weeks ago
cashflowre.app · 2026-05-29