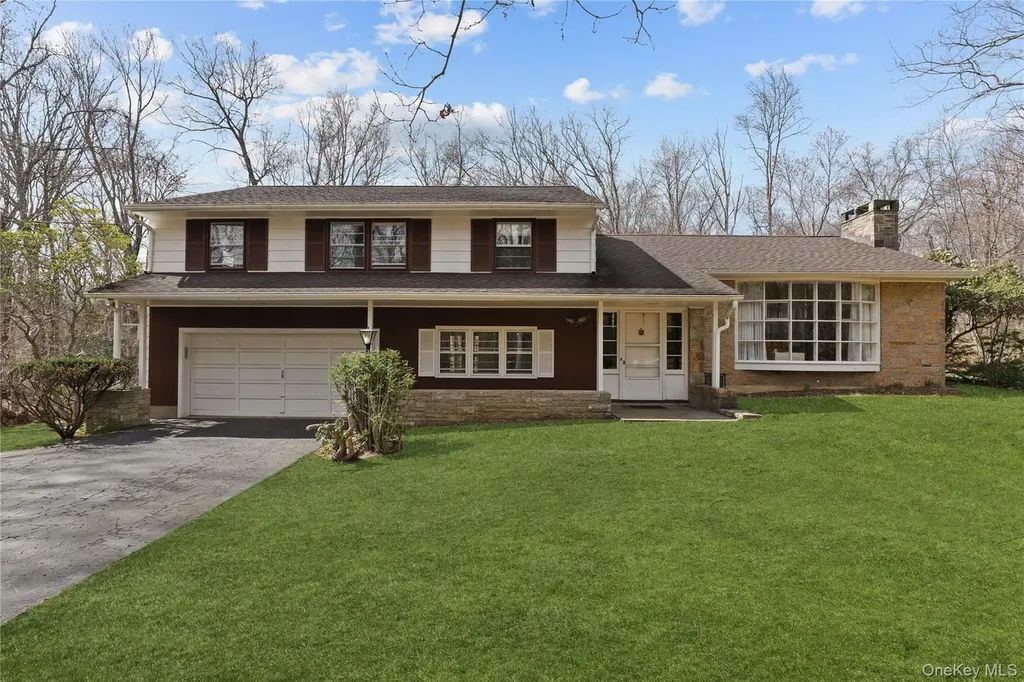
15 Laurel Rd · Scotts Corners, NY
Flood risk 1/10 · Minimal
- FEMA flood zone
- X (unshaded)
- Chance of flooding over 30 yrs
- 0.0%
- Est. flood insurance / yr
- $473 – $860
Fire risk 4/10 · Minor
- Est. fire insurance / yr
- $691 – $1,283
Heat risk 4/10 · Minor
- Hot days now (above 99°F)
- 7 days/yr
- Hot days in 30 yrs
- 16 days/yr
Wind risk 6/10 · Moderate
- Chance of severe wind over 30 yrs
- 27.0%
Air-quality risk 4/10 · Minor
- Unhealthy air days now
- 3 days/yr
- Unhealthy air days in 30 yrs
- 5 days/yr
Risk factors via First Street. Map © Google.
Why this score? — see what drove the C grade
The composite is a weighted blend of 9 inputs, each scored 0–100. Each bar is that input's sub-score; the figure is the points it added to the 100-point composite (weight × sub-score).
- Cash flow +16.1/30.0
- ARV discount +15.0/15.0
- Appreciation +6.9/10.0
- Schools +5.3/10.0
- DSCR +5.0/10.0
- 1% rule +3.4/10.0
- Livability +3.2/5.0
- Rent growth +2.5/5.0
- Condition / age +2.5/5.0
$789,000
🖨 Deal sheet 📄 Offer letter ✓ Due diligence
Listing remarks MLS
*4/20/26 Best and final offers due on Tuesday 4/21 at 12 noon.* Owned by the same family for more than 50 years, this light-filled 4-bedroom, 2.5 bath home offers a spacious, easy flow. Mostly original to its build date, it's complimented by hardwood floors throughout and a stylishly renovated primary bath. Set on 2 acres in the heart of Pound Ridge, the property delivers a sense of privacy with convenient access to local amenities. Enjoy abundant outdoor space for projects or gardening and the opportunity to make this much-loved home your own.
Key facts
- 2.08 acre lot
- 2 garage spots
- Built 1958
Neighborhood map
What this means for you Summary
Snapshot
- This is a 4-bed/2.5-bath single-family listed at $789k.
Deal economics
- At list price, monthly cash flow is $411 ($5k/yr) — positive.
- The deal already cash-flows at list — no discount required.
- To meet the 1% rule (rent ≥ 1% of price), the offer needs to be $661k (16.3% below list).
- Recommended offer: $661k (16.3% below list) — sets the bar for 1% rule.
- Cap rate 6.9% vs local median 2.6% in Scotts Corners — top-decile yield for the area; either an underpriced asset or a hidden risk that comps aren't pricing in. Stress-test before assuming the spread holds.
Location & tenants
- Location reads 63/100 on livability (#810 in NY) — a middle-class / working-renter tenant base. Strengths: crime A+, employment A+, housing B+; Watch: schools C-, amenities F, commute F.
- Bedford Central School District (rural): math 54% / reading 60% proficiency, ranked #211 of 590 in NY (top 36%) — acceptable for families but not a draw, mixed tenant base, ~2y average lease; only 10% free/reduced lunch — higher-income household profile.
- Market conditions: 69 active listings in the ZIP; 2 comparable units currently listed for rent nearby; 954 units permitted in Westchester County in 2024 (649 in 5+ unit buildings).
Forward outlook
- In year one you build about $36k of equity ($5k loan paydown + $30k appreciation (3.8% local appreciation)).
- Westchester County population projected at +10% by 2050 — modest demand growth; plan on rents tracking national, not racing it.
- At projected returns (3.8% appreciation + 3.0% rent growth), your $221k cash investment doubles in ~5 years — after that, you're playing with house money.
- By year 2, paydown + projected appreciation supports a ~$58k cash-out refi (75% LTV) — recoverable capital for the next deal without selling this one.
Negotiation context
- It's been on market 19 days — a 2% lower offer ($777k) is reasonable based on typical stale-listing flexibility.
Risks & watch-outs
- Watch-outs: built in 1958 — expect roof / HVAC / electrical / plumbing capex.
- Climate carrying-cost: major wind risk, 27% chance of damaging wind over 30y — expect insurance premiums to compound above CPI over the hold.
Questions for the listing agent
- Built in 1958 — when were the roof, HVAC, electrical panel, plumbing, and water heater last replaced?
- Is there a deadline driving the sale (1031 exchange, divorce, estate, relocation)? That informs how much negotiation room exists.
- What's the average days-on-market for RENTAL listings here right now (not sales)? A rising rental-DOM trend means longer vacancies and softer asking-rent achievability than the comps imply.
- What's the recent tenant-quality profile in this submarket — average credit score on applications, eviction rate, late-payment / NSF rate, and stable-employment percentage? A property-management company in the area should have these aggregated.
- How much new for-sale + rental construction is in the pipeline within 1–3 miles? Heavy new supply typically softens prices + rents 12–24 months out; constrained supply supports both.
Investment metrics
- 1% rule
- 0.84% ✗
- Cap rate
- 6.92%
- Cash-on-cash
- 2.23%
- DSCR
- 1.10
- GRM
- 10.0
CMA / ARV
- ARV (median comp)
- $1,126,310
- List price
- $789,000
- Delta
- -29.95%
- Verdict
- UNDERPRICED
- Comps
- 10 within 1.0 mi
Show comp detail 4 sales within ~0.75 mi
| Address | Dist | Beds/Ba | Sqft | Sold | Price | $/sf | Match |
|---|---|---|---|---|---|---|---|
| 27 Davids Ln | 0.29mi | 4/2.0 | 2,498 (+10%) | 15mo | $910,000 | $364 | 55 |
| 11 Davids Ln | 0.39mi | 3/2.5 (-1) | 2,462 (+8%) | 22mo | $922,000 | $374 | 45 |
| 66 Eastwoods Rd | 0.45mi | 4/3.5 | 2,591 (+14%) | 15mo | $1,495,000 | $577 | 39 |
| 6 Kinnicutt Rd | 0.70mi | 3/2.5 (-1) | 2,440 (+7%) | 20mo | $900,000 | $369 | 33 |
Match score weights: distance 35% · size 25% · config 20% · recency 20%. Top-matched comps best support the ARV.
Projected returns pro-forma
3.84% appreciation · 3.0% rent growth · sell at horizon
- IRR
- 11.8%
- Equity multiple
- 1.71×
- Total profit
- $156,476
- Equity at exit
- $392,587
- IRR
- 13.4%
- Equity multiple
- 3.16×
- Total profit
- $477,644
- Equity at exit
- $636,238
Cash invested: $220,920 (down + closing). Projections, not guarantees.
Landlord ↔ Tenant lean methodology
- Overall (STATE)
- 15 Strongly Tenant-Friendly
- State New York
- 15 Strongly Tenant-Friendly · D+10
- County
- — inherits STATE
- City
- — inherits STATE
ZIP-level market 10576
- Home prices YoY
- 1.6%
- Active inventory
- 69
- Price-to-rent
- 10.0×
Monthly cashflow live
- Estimated rent
- $6,606 medium interval (Pro) →
- Mortgage (P&I)
- −$4,138
- Tax from tax record
- −$341 /mo · $4,097/yr
- Insurance
- −$329
- HOA
- −$0
- Vacancy / Maint / Mgmt
- −$1,387
- Net cashflow
- $411
Break-even live
UW: 25.0% down · 7.5% · 30yr · 1.5% tax · 5.0% vac · 8.0% maint · 8.0% mgmt
Financing live
Cash to close
- Down payment
- $197,250
- Closing costs
- $23,670
- Reserves months
- —
- Total cash needed
- —
Loan-product check · same deal, 3 products live
Conventional
25% down · 7.5% · 30yr
- Down + closing
- —
- Monthly P&I
- —
- Monthly cashflow
- —
- DSCR
- —
- Eligible?
- —
Personal DTI + credit; lowest rate.
DSCR
20% down · 8.5% · 30yr
- Down + closing
- —
- Monthly P&I
- —
- Monthly cashflow
- —
- DSCR
- —
- Eligible?
- —
No personal income docs; deal must DSCR.
Hard money
10% down · 12.0% · 12mo
- Down + closing
- —
- Monthly P&I
- —
- Monthly cashflow
- —
- DSCR
- —
- Eligible?
- —
Short-term bridge; refi at stabilization.
Rent comps 2 comps
| Address | Beds | Baths | Sqft | Rent | $/sqft | DOM | Units | Dist |
|---|---|---|---|---|---|---|---|---|
| 903 Oakridge Cmns South Salem, NY | 3.0 | 2.0 | 2059 | $6,800 | $3.30 | 43d | 1 | 1.34mi |
| 905 Oakridge Cmns South Salem, NY | 3.0 | 3.0 | 1938 | $6,400 | $3.30 | 21d | 1 | 1.34mi |
Listing history 3 events
-
2026-05-04status Pending 559-char remark
Show marketing remark (559 chars)
*4/20/26 Best and final offers due on Tuesday 4/21 at 12 noon.* Owned by the same family for more than 50 years, this light-filled 4-bedroom, 2.5 bath home offers a spacious, easy flow. Mostly original to its build date, it's complimented by hardwood floors throughout and a stylishly renovated primary bath. Set on 2 acres in the heart of Pound Ridge, the property delivers a sense of privacy with convenient access to local amenities. Enjoy abundant outdoor space for projects or gardening and the opportunity to make this much-loved home your own.
-
2026-04-16$789,000 Active 559-char remark
Show marketing remark (559 chars)
*4/20/26 Best and final offers due on Tuesday 4/21 at 12 noon.* Owned by the same family for more than 50 years, this light-filled 4-bedroom, 2.5 bath home offers a spacious, easy flow. Mostly original to its build date, it's complimented by hardwood floors throughout and a stylishly renovated primary bath. Set on 2 acres in the heart of Pound Ridge, the property delivers a sense of privacy with convenient access to local amenities. Enjoy abundant outdoor space for projects or gardening and the opportunity to make this much-loved home your own.
-
2026-04-15historical $789,000 559-char remark
Show marketing remark (559 chars)
*4/20/26 Best and final offers due on Tuesday 4/21 at 12 noon.* Owned by the same family for more than 50 years, this light-filled 4-bedroom, 2.5 bath home offers a spacious, easy flow. Mostly original to its build date, it's complimented by hardwood floors throughout and a stylishly renovated primary bath. Set on 2 acres in the heart of Pound Ridge, the property delivers a sense of privacy with convenient access to local amenities. Enjoy abundant outdoor space for projects or gardening and the opportunity to make this much-loved home your own.
ⓘ Source: listings_history table (triggers on properties + properties_extension) + one-shot
backfill from property_details.listing_events for pre-trigger history.
Tax reassessment forecast NY · Partial reset (capped growth)
- Current annual tax
- $4,097 · $341/mo
- Projected year-2 tax
- $8,716 · $726/mo
- Expected delta
- +$4,618/yr (+$385/mo · 112.7%)
ⓘ Screening estimate from a state-policy table — verify with the county assessor before closing.
Climate risk First Street
- Flood 1/10 Low FEMA zone X (unshaded) · 0% chance over 30 yrs
- Wildfire 4/10 Moderate
- Heat 4/10 Moderate 7 d/yr ≥99°F today · 16 d/yr by 30 yrs out
- Wind 6/10 Major 27% chance of damaging wind over 30 yrs
- Air quality 4/10 Moderate 3 unhealthy d/yr today · 5 by 30 yrs out
Nearby sold comps map
Loading sold comps map…
Walkable amenities ~0.75 mi
Loading nearby amenities…
Taxation est. · year 1
- Rental income
- $79,273
- − Mortgage interest
- −$44,196
- − Property taxes
- −$4,097
- − Insurance
- −$3,945
- − Repairs & maintenance
- −$6,342
- − Management
- −$6,342
- − Depreciation
- −$22,953
- Taxable loss
- −$8,602
- Est. tax savings @ 24.0%
- +$2,065
- After-tax cash flow
- $6,996/yr
For passive investors: Depreciation is non-cash, so a rental often shows a tax loss while cash-flowing — sheltering income. Rental losses are passive: they offset passive income freely, and up to $25,000/yr can offset ordinary (W-2) income if you actively participate and your MAGI is under $100k (phasing out to $0 by $150k); unused losses carry forward. On sale, claimed depreciation is recaptured at up to 25%, and gains may owe capital-gains tax (a 1031 exchange can defer both). Figures are a year-1 estimate at your 24.0% rate — not tax advice; consult a CPA.
Schools (NCES district)
- District
- Bedford Central School District
- NCES district ID
- 3619950
- Math proficiency
- 54% ▼ -9.00%
- Reading proficiency
- 60% ▬ 0.00%
- Median HH income
- $98,055
- Composite
- 53.17/100
- National rank
- #1508
- State rank
- #211 of 590 in NY
Livability — Scotts Corners
- Score
- 63/100
- State rank
- #810
- US rank
- #15702
Category grades
Schools grade is shown separately in the Schools card above.
Census & demographics
- Population (ZIP)
- 4,904
Population outlook (Westchester County) Hauer SSP2
- Today (2025)
- 1,028,035 people
- By 2030
- 1,051,636 · +2.3%
- By 2040
- 1,098,520 · +6.9%
- By 2050
- 1,136,044 · +10.5%
- By 2075
- 1,196,925 · +16.4%
- By 2100
- 1,175,147 · +14.3%
Race, ethnicity, and origin ACS 2023
- Neighborhood character
- Predominantly White (90%)
- Race & ethnicity
- White 90% Hispanic / Latino 4% Two or more races 3% Asian 2% Black 1%
- Common ancestry
- Romanian 6% Scotch-Irish 4% Italian 3%
- Foreign-born
- 10% · Canada, China, Jamaica
- Languages at home
- 88% English-only · Other Indo-European 5% Spanish 3% French/Haitian/Cajun 2%
Political lean MEDSL · Westchester
- 2024 margin
- Strong D (+26.3) · D 63.1% · R 36.9%
- 2008→2024 swing
- -1.3pp toward R · 2008: 27.6pp · 2024: 26.3pp
- All cycles
- 2024: D+26.3 2020: D+36.3 2016: D+32.8 2012: D+22.2 2008: D+27.6
Not yet ingested
- Civics
- —
Market trends
- HPI YoY
- ▲ 3.84%
- Current HPI
- 239.5803
- Rent YoY
- —
- Metro
- —
- State GDP YoY
- ▲ 2.60%
- F500 in state
- 92
Industry mix (Fortune 500 HQ in NY)
| Industry | F500 HQs | Revenue |
|---|---|---|
| Financial Services | 10 | $950B |
|
||
| Consumer Goods | 9 | $162B |
|
||
| Insurance | 4 | $225B |
|
||
| Telecommunications | 2 | $144B |
|
||
| Pharmaceuticals | 2 | $112B |
|
||
| Media / Entertainment | 2 | $69B |
|
||
Price history
+0.0% since first listed3 events — show timeline
- 2026-05-04 Pending — OneKey® MLS as Distributed by MLS Grid
- 2026-04-16 Listed $789,000 OneKey® MLS as Distributed by MLS Grid
- 2026-04-15 Coming Soon $789,000 OneKey® MLS as Distributed by MLS Grid
Property tax history
-10.9%/yrLatest (2025): $4,097 · -55.8% YoY. Source: county tax records.
Cash-flow waterfall
monthlySold comps — $/sqft
last 12 mo · ≤1 miLoading sold comps…