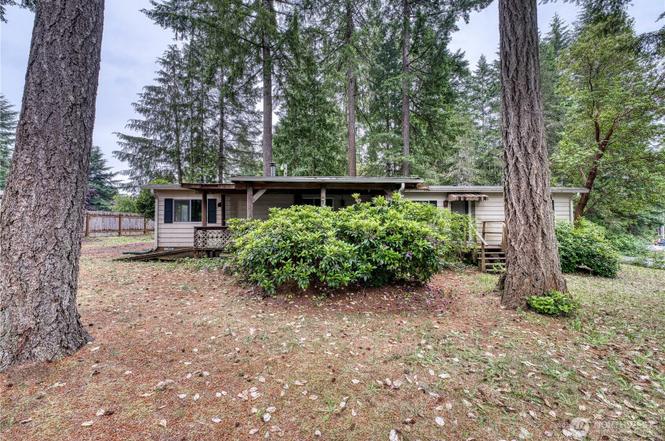
270 NE Saber Dr
Belfair, WA 98528
$269,950D+
3 bd · 2.0 ba ·
1,536 sqft ·
Built 1978
· Manufactured
· Pending
· 4 DOM
Cashflow @ list (25.0% down · 7.5%)
Estimated rent
$2,194/mo
Mortgage (P&I)
−$1,416
Tax + insurance
−$265
HOA
−$27
Vac / Maint / Mgmt
−$461
Net cashflow
$26/mo
Annual
$308/yr
Cap rate
6.41%
Cash-on-cash
0.41%
DSCR
1.02
1% rule
0.81%
Cash to close
$75,586
Investor read
- This is a 3-bed/2.0-bath manufactured listed at $270k.
- At list price, monthly cash flow is $26 ($308/yr) — positive.
- The deal already cash-flows at list — no discount required.
- To meet the 1% rule (rent ≥ 1% of price), the offer needs to be $219k (18.7% below list).
- Only 4 days on market — expect competitive offers; lowballing is unlikely to land.
- Recommended offer: $219k (18.7% below list) — sets the bar for 1% rule.
- Local home prices are declining (-3.0%/yr); year-one equity from $2k of loan paydown is wiped out by about $8k of value loss. Plan a longer hold.
- Location reads 68/100 on livability (#272 in WA) — a middle-class / working-renter tenant base. Strengths: housing A+, cost of living A-; Watch: health & safety C-, amenities F, commute F.
- North Mason School District (rural): math 32% / reading 41% proficiency, ranked #233 of 291 in WA (top 80%) — families likely to look elsewhere, expect single-tenant / working-renter base with shorter leases.
- Zoned schools: Belfair Elementary (461 students, 44% FRL); North Mason Senior High School (663 students, 39% FRL) — zoned schools at 42% FRL track the district average.
- Market conditions: 145 active listings in the ZIP; 2 comparable units currently listed for rent nearby; 299 units permitted in Mason County in 2024 (0 in 5+ unit buildings).
- Mason County population projected at -14% by 2050 — secular population decline; favor cash flow + early exit over multi-decade hold.
- 2 sale attempts since 26y ago with the ask held roughly flat each time — persistent listings suggest the price (not the market) is what's stuck; bring a comps-based counter.
- Current owner paid $82k; list at $270k implies a 230% gain — meaningful room to come down on a strong offer.
- Cap rate 6.4% vs local median 2.8% in Belfair — top-decile yield for the area; either an underpriced asset or a hidden risk that comps aren't pricing in. Stress-test before assuming the spread holds.
Questions for listing agent
- Built in 1978 — when were the roof, HVAC, electrical panel, plumbing, and water heater last replaced?
- What does the HOA fee cover, when was the last increase, and are there any pending special assessments or reserve-fund shortfalls?
- Is there a deadline driving the sale (1031 exchange, divorce, estate, relocation)? That informs how much negotiation room exists.
- Schools are F-rated, which usually means shorter tenancies and higher turnover. Who's the typical renter profile here, and what's been the actual vacancy rate?
- The area grade is low — what's the realistic commute time and amenity access for the typical tenant pool here? Any planned neighborhood developments (good or bad) we should know about?
- What's the average days-on-market for RENTAL listings here right now (not sales)? A rising rental-DOM trend means longer vacancies and softer asking-rent achievability than the comps imply.
- What's the recent tenant-quality profile in this submarket — average credit score on applications, eviction rate, late-payment / NSF rate, and stable-employment percentage? A property-management company in the area should have these aggregated.
- How much new for-sale + rental construction is in the pipeline within 1–3 miles? Heavy new supply typically softens prices + rents 12–24 months out; constrained supply supports both.
CashFlowRE · CFR-87R2NZ96M11NDA
· Data 2 days ago
cashflowre.app · 2026-05-29