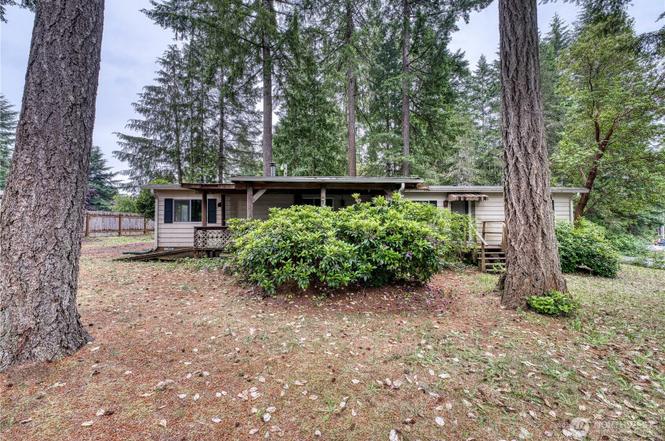
270 NE Saber Dr · Belfair, WA
Flood risk 1/10 · Minimal
- FEMA flood zone
- X (unshaded)
- Chance of flooding over 30 yrs
- 0.0%
- Est. flood insurance / yr
- $507 – $1,088
Fire risk 2/10 · Minimal
- Est. fire insurance / yr
- $604 – $1,122
Heat risk 3/10 · Minor
- Hot days now (above 87°F)
- 7 days/yr
- Hot days in 30 yrs
- 14 days/yr
Wind risk 1/10 · Minimal
- Chance of severe wind over 30 yrs
- —
Air-quality risk 6/10 · Moderate
- Unhealthy air days now
- 8 days/yr
- Unhealthy air days in 30 yrs
- 8 days/yr
Risk factors via First Street. Map © Google.
Why this score? — see what drove the D+ grade
The composite is a weighted blend of 9 inputs, each scored 0–100. Each bar is that input's sub-score; the figure is the points it added to the 100-point composite (weight × sub-score).
- ARV discount +15.0/15.0
- Cash flow +13.8/30.0
- DSCR +4.2/10.0
- Schools +3.5/10.0
- Livability +3.4/5.0
- 1% rule +3.1/10.0
- Rent growth +2.5/5.0
- Condition / age +2.5/5.0
- Appreciation +0.0/10.0
$269,950
🖨 Deal sheet 📄 Offer letter ✓ Due diligence
Listing remarks
Bring your vision to this spacious 3-bedroom, 2-bath manufactured home offering 1,536 square feet in Belfair’s Beards Cove community. With a functional floor plan, generous living spaces, and a primary suite, this property presents an excellent opportunity for buyers looking to update, renovate, and build equity. Multiple outbuildings provide additional storage, workshop, hobby, or project space, adding to the property’s versatility. Nestled in a neighborhood known for its access to the natural beauty of Hood Canal, Beards Cove offers community amenities and a convenient location near shopping, dining, schools, and everyday services. Outdoor enthusiasts will appreciate nearby op
Key facts
- Community amenities
- Hiking
- 0.28 acre lot
Tags
Property features AI
Finance
- Other: Listing is active
- Financial info: Financing options: Cash, Conventional, FHA, Rehab loan, VA loan (see remarks)
- HOA & community: Homeowners association managed by CWD Group Inc; Annual association fee of $324 covering common area maintenance
Exterior
- Parking: Driveway; Off-street parking; RV parking
- Security: Fully fenced
- Utilities: Electric energy source; Community water (Beards Cove Water); Septic system; Power provided by Mason Co PUD #3; Electric water heater
- Home design: Manufactured on land (double wide); Detached manufactured home; One level; Main entry; Faces south; Corner lot, paved
- Construction: Metal/vinyl construction; Composition roof; Block foundation; Built as a double-wide manufactured house
- Exterior features: Metal/vinyl exterior; Deck; Fully fenced; Cable TV available; RV parking; Fruit trees, garden space, wooded areas
Interior
- Kitchen: Dishwasher; Double oven; Garbage disposal; Refrigerator; Stove/Range
- Bedrooms: Three bedrooms (all on main level)
- Flooring: Vinyl; Carpet
- Bathrooms: Two full bathrooms (both on main level); Two bathtubs; Two showers
- Heating & cooling: Forced air heating; Free-standing stove; No central cooling
- Interior features: Ceiling fans; Dining room; Fireplace (wood burning); Pantry; Electric water heater
- Laundry & utility: Washer included
Neighborhood map
What this means for you Summary
Snapshot
- This is a 3-bed/2.0-bath manufactured listed at $270k.
Deal economics
- At list price, monthly cash flow is $26 ($308/yr) — positive.
- The deal already cash-flows at list — no discount required.
- To meet the 1% rule (rent ≥ 1% of price), the offer needs to be $219k (18.7% below list).
- Recommended offer: $219k (18.7% below list) — sets the bar for 1% rule.
- Cap rate 6.4% vs local median 2.8% in Belfair — top-decile yield for the area; either an underpriced asset or a hidden risk that comps aren't pricing in. Stress-test before assuming the spread holds.
Location & tenants
- Location reads 68/100 on livability (#272 in WA) — a middle-class / working-renter tenant base. Strengths: housing A+, cost of living A-; Watch: health & safety C-, amenities F, commute F.
- North Mason School District (rural): math 32% / reading 41% proficiency, ranked #233 of 291 in WA (top 80%) — families likely to look elsewhere, expect single-tenant / working-renter base with shorter leases.
- Zoned schools: Belfair Elementary (461 students, 44% FRL); North Mason Senior High School (663 students, 39% FRL) — zoned schools at 42% FRL track the district average.
- Market conditions: 145 active listings in the ZIP; 2 comparable units currently listed for rent nearby; 299 units permitted in Mason County in 2024 (0 in 5+ unit buildings).
Forward outlook
- Local home prices are declining (-3.0%/yr); year-one equity from $2k of loan paydown is wiped out by about $8k of value loss. Plan a longer hold.
- Mason County population projected at -14% by 2050 — secular population decline; favor cash flow + early exit over multi-decade hold.
Negotiation context
- Only 4 days on market — expect competitive offers; lowballing is unlikely to land.
- 2 sale attempts since 26y ago with the ask held roughly flat each time — persistent listings suggest the price (not the market) is what's stuck; bring a comps-based counter.
- Current owner paid $82k; list at $270k implies a 230% gain — meaningful room to come down on a strong offer.
Questions for the listing agent
- Built in 1978 — when were the roof, HVAC, electrical panel, plumbing, and water heater last replaced?
- What does the HOA fee cover, when was the last increase, and are there any pending special assessments or reserve-fund shortfalls?
- Is there a deadline driving the sale (1031 exchange, divorce, estate, relocation)? That informs how much negotiation room exists.
- Schools are F-rated, which usually means shorter tenancies and higher turnover. Who's the typical renter profile here, and what's been the actual vacancy rate?
- The area grade is low — what's the realistic commute time and amenity access for the typical tenant pool here? Any planned neighborhood developments (good or bad) we should know about?
- What's the average days-on-market for RENTAL listings here right now (not sales)? A rising rental-DOM trend means longer vacancies and softer asking-rent achievability than the comps imply.
- What's the recent tenant-quality profile in this submarket — average credit score on applications, eviction rate, late-payment / NSF rate, and stable-employment percentage? A property-management company in the area should have these aggregated.
- How much new for-sale + rental construction is in the pipeline within 1–3 miles? Heavy new supply typically softens prices + rents 12–24 months out; constrained supply supports both.
Investment metrics
- 1% rule
- 0.81% ✗
- Cap rate
- 6.41%
- Cash-on-cash
- 0.41%
- DSCR
- 1.02
- GRM
- 10.3
CMA / ARV
- ARV (on-the-fly)
- $388,608
- Comps found
- 10
Show comp detail 10 sales within ~0.75 mi
| Address | Dist | Beds/Ba | Sqft | Sold | Price | $/sf | Match |
|---|---|---|---|---|---|---|---|
| 31 NE Sail Loft Ct | 0.17mi | 3/2.0 | 1,500 (-2%) | 10mo | $410,000 | $273 | 80 |
| 391 NE Larson Lake Rd | 0.50mi | 3/2.0 | 1,512 (-2%) | 8mo | $450,000 | $298 | 68 |
| 500 NE Larson Lake Rd | 0.36mi | 3/2.0 | 1,620 (+6%) | 8mo | $492,000 | $304 | 67 |
| 91 NE Captian Hook Dr | 0.15mi | 2/2.0 (-1) | 1,496 (-3%) | 22mo | $390,000 | $261 | 65 |
| 61 NE Larson Lake Ln | 0.45mi | 3/2.0 | 1,620 (+6%) | 8mo | $375,000 | $231 | 63 |
| 70 NE Pegleg Ct | 0.55mi | 3/2.0 | 1,456 (-5%) | 11mo | $355,000 | $244 | 56 |
| 41 NE Admiral Dr | 0.40mi | 3/2.0 | 1,620 (+6%) | 19mo | $400,000 | $247 | 56 |
| 116 NE Larson Lake Rd | 0.65mi | 3/2.0 | 1,492 (-3%) | 17mo | $378,000 | $253 | 51 |
| 501 NE Larson Lake Rd | 0.34mi | 2/2.0 (-1) | 1,680 (+9%) | 20mo | $410,000 | $244 | 47 |
| 281 NE Schooner Loop | 0.61mi | 3/2.0 | 1,620 (+6%) | 20mo | $399,900 | $247 | 46 |
Match score weights: distance 35% · size 25% · config 20% · recency 20%. Top-matched comps best support the ARV.
Projected returns pro-forma
-3.0% appreciation · 3.0% rent growth · sell at horizon
- IRR
- -15.7%
- Equity multiple
- 0.44×
- Total profit
- $-42,171
- Equity at exit
- $40,250
- IRR
- -7.3%
- Equity multiple
- 0.54×
- Total profit
- $-34,875
- Equity at exit
- $23,340
Cash invested: $75,586 (down + closing). Projections, not guarantees.
Landlord ↔ Tenant lean methodology
- Overall (STATE)
- 28 Tenant-Leaning
- State Washington
- 28 Tenant-Leaning · D+8
- County
- — inherits STATE
- City
- — inherits STATE
ZIP-level market 98528
- Active inventory
- 145
- Price-to-rent
- 10.3×
Monthly cashflow live
- Estimated rent
- $2,194 medium interval (Pro) →
- Mortgage (P&I)
- −$1,416
- Tax from tax record
- −$153 /mo · $1,834/yr
- Insurance
- −$112
- HOA
- −$27
- Vacancy / Maint / Mgmt
- −$461
- Net cashflow
- $26
Break-even live
UW: 25.0% down · 7.5% · 30yr · 1.5% tax · 5.0% vac · 8.0% maint · 8.0% mgmt
Financing live
Cash to close
- Down payment
- $67,488
- Closing costs
- $8,098
- Reserves months
- —
- Total cash needed
- —
Loan-product check · same deal, 3 products live
Conventional
25% down · 7.5% · 30yr
- Down + closing
- —
- Monthly P&I
- —
- Monthly cashflow
- —
- DSCR
- —
- Eligible?
- —
Personal DTI + credit; lowest rate.
DSCR
20% down · 8.5% · 30yr
- Down + closing
- —
- Monthly P&I
- —
- Monthly cashflow
- —
- DSCR
- —
- Eligible?
- —
No personal income docs; deal must DSCR.
Hard money
10% down · 12.0% · 12mo
- Down + closing
- —
- Monthly P&I
- —
- Monthly cashflow
- —
- DSCR
- —
- Eligible?
- —
Short-term bridge; refi at stabilization.
Rent comps 2 comps
| Address | Beds | Baths | Sqft | Rent | $/sqft | DOM | Units | Dist |
|---|---|---|---|---|---|---|---|---|
| 101 NE Allen Ct Belfair, WA | 2.0 | 2.0 | 1188 | $1,995 | $1.68 | 43d | 1 | 0.67mi |
| 80 NE Davey Jones Ct Belfair, WA | 3.0 | 2.5 | 1480 | $2,400 | $1.62 | 21d | 1 | 0.86mi |
HOA detail
- Monthly dues
- $27 · $324/yr
Listing history 6 events
-
2026-06-18status $269,950 Pending 4 DOM
-
2026-06-18days on market $269,950 Active 4 DOM
-
2026-06-17days on market $269,950 Active 3 DOM
-
2026-06-16days on market $269,950 Active 2 DOM
-
2026-06-15remarks 687-char remark
-
2026-06-15$269,950 Active 1 DOM
ⓘ Source: listings_history table (triggers on properties + properties_extension) + one-shot
backfill from property_details.listing_events for pre-trigger history.
Tax reassessment forecast WA · Resets to sale price
- Current annual tax
- $1,834 · $153/mo
- Projected year-2 tax
- $2,646 · $220/mo
- Expected delta
- +$812/yr (+$68/mo · 44.3%)
ⓘ Screening estimate from a state-policy table — verify with the county assessor before closing.
Climate risk First Street
- Flood 1/10 Low FEMA zone X (unshaded) · 0% chance over 30 yrs
- Wildfire 2/10 Low
- Heat 3/10 Moderate 7 d/yr ≥87°F today · 14 d/yr by 30 yrs out
- Wind 1/10 Low
- Air quality 6/10 Major 8 unhealthy d/yr today · 8 by 30 yrs out
Nearby sold comps map
Loading sold comps map…
Walkable amenities ~0.75 mi
Loading nearby amenities…
Taxation est. · year 1
- Rental income
- $26,333
- − Mortgage interest
- −$15,121
- − Property taxes
- −$1,834
- − Insurance
- −$1,350
- − Repairs & maintenance
- −$2,107
- − Management
- −$2,107
- − HOA
- −$324
- − Depreciation
- −$7,853
- Taxable loss
- −$4,362
- Est. tax savings @ 24.0%
- +$1,047
- After-tax cash flow
- $1,355/yr
For passive investors: Depreciation is non-cash, so a rental often shows a tax loss while cash-flowing — sheltering income. Rental losses are passive: they offset passive income freely, and up to $25,000/yr can offset ordinary (W-2) income if you actively participate and your MAGI is under $100k (phasing out to $0 by $150k); unused losses carry forward. On sale, claimed depreciation is recaptured at up to 25%, and gains may owe capital-gains tax (a 1031 exchange can defer both). Figures are a year-1 estimate at your 24.0% rate — not tax advice; consult a CPA.
Schools (NCES district)
- District
- North Mason School District
- NCES district ID
- 5305790
- Math proficiency
- 32% ▼ -4.00%
- Reading proficiency
- 41% ▼ -5.00%
- Median HH income
- $55,458
- Composite
- 34.67/100
- National rank
- #10069
- State rank
- #233 of 291 in WA
Livability — Belfair
- Score
- 68/100
- State rank
- #272
- US rank
- #9436
Category grades
Schools grade is shown separately in the Schools card above.
Census & demographics
- Census place
- Belfair, WA
- Population (ZIP)
- 12,398
Population outlook (Mason County) Hauer SSP2
- Today (2025)
- 60,005 people
- By 2030
- 58,567 · -2.4%
- By 2040
- 54,735 · -8.8%
- By 2050
- 51,470 · -14.2%
- By 2075
- 46,276 · -22.9%
- By 2100
- 39,883 · -33.5%
Race, ethnicity, and origin ACS 2023
- Neighborhood character
- Predominantly White (75%)
- Race & ethnicity
- White 75% Hispanic / Latino 12% Two or more races 9% Black 2% Asian 2%
- Hispanic origin (detail)
- Mexican 4%
- Common ancestry
- Portuguese 7% Italian 6% Slovak 5%
- Foreign-born
- 7% · Canada, Vietnam
- Languages at home
- 90% English-only · Spanish 7% Other Indo-European 1% Vietnamese 1%
Political lean MEDSL · Mason
- 2024 margin
- Toss-up / Even · D 47.2% · R 49.7% · Other 3.2%
- 2008→2024 swing
- -11.2pp toward R · 2008: 8.7pp · 2024: -2.5pp
- All cycles
- 2024: R+2.5 2020: R+3.9 2016: R+6.0 2012: D+6.9 2008: D+8.7
Not yet ingested
- Civics
- —
Market trends
- HPI YoY
- ▼ -207.97%
- Current HPI
- 205.0499
- Rent YoY
- —
- Metro
- —
- State GDP YoY
- ▲ 4.65%
- F500 in state
- 22
Industry mix (Fortune 500 HQ in WA)
| Industry | F500 HQs | Revenue |
|---|---|---|
| Retail | 2 | $269B |
|
||
| Technology / Retail | 1 | $638B |
|
||
| Technology | 1 | $245B |
|
||
| Telecommunications | 1 | $38B |
|
||
| Food / Beverage | 1 | $36B |
|
||
| Automotive / Trucks | 1 | $34B |
|
||
Price history
+201.6% since first listed3 events — show timeline
- 2026-06-14 Listed $269,950 NWMLS as Distributed by MLS Grid
- 2001-03-21 Sold (MLS) $81,700 NWMLS as Distributed by MLS Grid
- 2000-11-22 Listed $89,500 NWMLS as Distributed by MLS Grid
Property tax history
+3.8%/yrLatest (2026): $1,834 · -11.1% YoY. Source: county tax records.
Cash-flow waterfall
monthlySold comps — $/sqft
last 12 mo · ≤1 miLoading sold comps…