2802 W Foothill Dr -- #15
Phoenix, AZ 85024
$34,000D+
2 bd · 1.0 ba ·
950 sqft ·
Built 1968
· Manufactured
· Active
· 251 DOM
Cashflow @ list (25.0% down · 7.5%)
Estimated rent
$1,580/mo
Mortgage (P&I)
−$178
Tax + insurance
−$57
HOA
−$0
Vac / Maint / Mgmt
−$332
Net cashflow
$1,014/mo
Annual
$12,163/yr
Cap rate
42.07%
Cash-on-cash
127.77%
DSCR
6.68
1% rule
4.65%
Cash to close
$9,520
Investor read
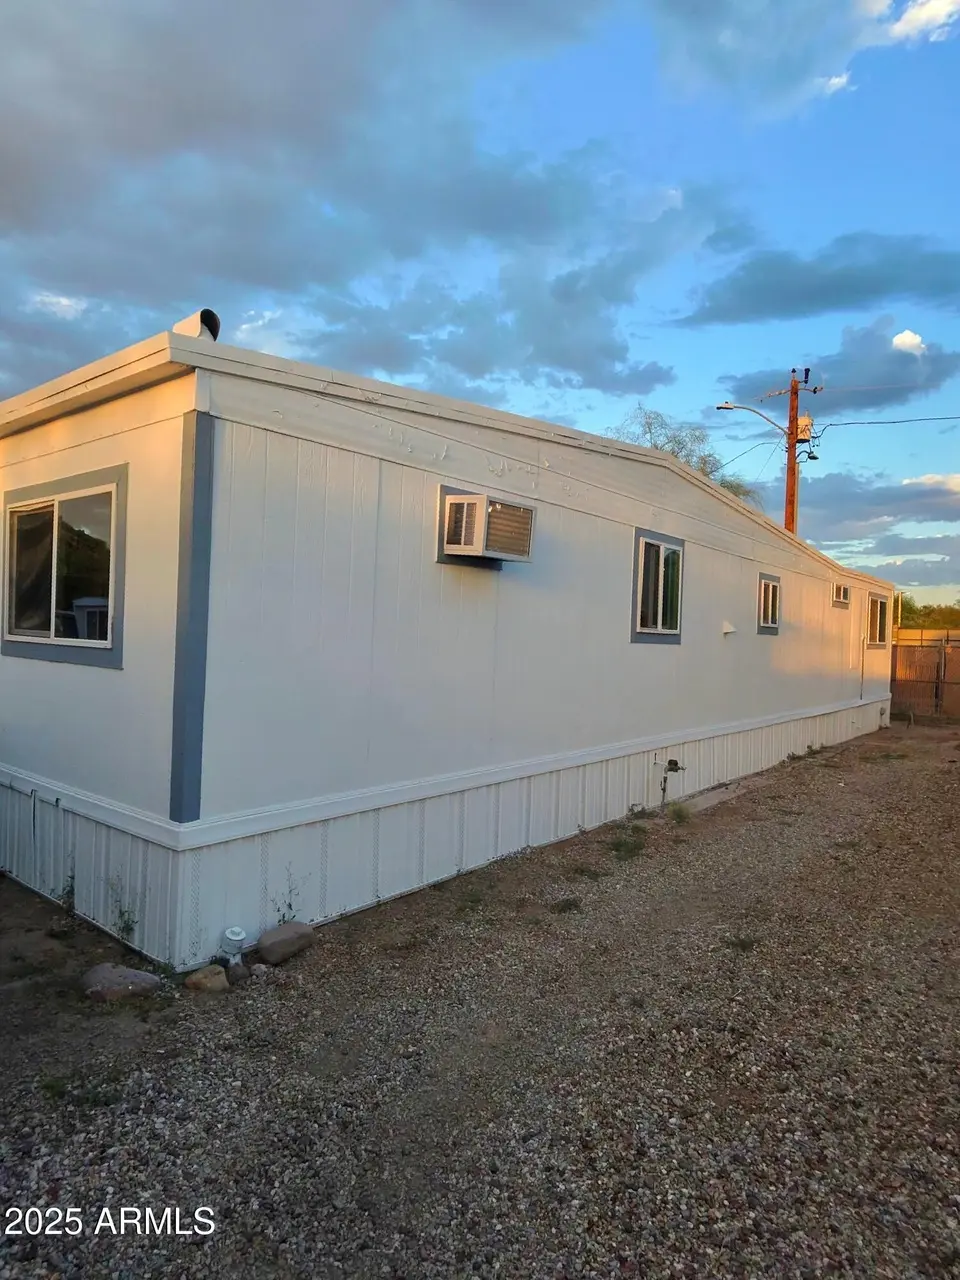
- This is a 2-bed/1.0-bath manufactured listed at $34k. Condition is rated fair.
- At list price, monthly cash flow is $1k ($12k/yr) — positive.
- The deal already cash-flows at list — no discount required.
- Meets the 1% rule at list price ($2k rent vs $34k).
- It's been on market 251 days — a 12% lower offer ($30k) is reasonable based on typical stale-listing flexibility.
- Recommended offer: $30k (12.0% below list) — sets the bar for market timing.
- Local home prices are declining (-3.0%/yr); year-one equity from $235 of loan paydown is wiped out by about $1k of value loss. Plan a longer hold.
- Location reads 75/100 on livability (#16 in AZ, #3,924 nationally) — a middle-class / working-renter tenant base. Strengths: amenities A+, commute A+, housing A+; Watch: health & safety C-, crime F.
- Deer Valley Unified District (4246) (urban): math 50% / reading 55% proficiency, ranked #33 of 249 in AZ (top 13%) — acceptable for families but not a draw, mixed tenant base, ~2y average lease.
- Market conditions: Rents rising (+1.4%/yr); 201 active listings in the ZIP; 29 comparable units currently listed for rent nearby; rentals at typical pace (median 16d on market — plan ~3-4 weeks tenant-placement turnaround); solid renter incomes; 36,011 units permitted in Maricopa County in 2024 (12,801 in 5+ unit buildings).
- Maricopa County population projected at +38% by 2050 — long-run rental-demand tailwind backs the buy-and-hold thesis.
- At projected returns (-3.0% appreciation + 1.4% rent growth), your $10k cash investment doubles in ~1 year — after that, you're playing with house money.
- Climate carrying-cost: moderate wildfire risk; extreme-heat days projected 7→18/yr by 2055 (HVAC capex compounding) — expect insurance premiums to compound above CPI over the hold.
- Cap rate 42.1% vs local median 3.3% in Phoenix — top-decile yield for the area; either an underpriced asset or a hidden risk that comps aren't pricing in. Stress-test before assuming the spread holds.
- This rent is only 18% of the median local income ($107k/yr) — well below the 30% rent-burden line; pricing power to push rent on renewal without tenant pushback.
Questions for listing agent
- It's been on market 251 days. Have you received any prior offers? Is the seller open to a 12% concession, seller financing, or rate buy-down credit?
- Have any recent inspections been done? Can we get a copy of the seller's disclosures and any deferred-maintenance estimates?
- Built in 1968 — when were the roof, HVAC, electrical panel, plumbing, and water heater last replaced?
- Why hasn't it sold? Are there any deal-killer items the seller is aware of (foundation, flood, title, zoning, code violations)?
- Is there a deadline driving the sale (1031 exchange, divorce, estate, relocation)? That informs how much negotiation room exists.
- Crime grade is F in this area — have there been break-ins, vandalism, or insurance claims at this property in the last 3 years? What carrier currently insures it and at what premium?
- The area grade is low — what's the realistic commute time and amenity access for the typical tenant pool here? Any planned neighborhood developments (good or bad) we should know about?
- What's the average days-on-market for RENTAL listings here right now (not sales)? A rising rental-DOM trend means longer vacancies and softer asking-rent achievability than the comps imply.
Repairs flagged (vision-AI assessment)
- Major: exterior siding — The siding is weathered and lacks paint, indicating significant wear.
- Major: roof — The roof appears to be in poor condition, with visible wear and potential damage.
- Major: fencing — The fencing is in poor condition, with visible damage and lack of maintenance.
CashFlowRE · CFR-88D10CDWXT4HN5
· Data 2 days ago
cashflowre.app · 2026-05-29